
In today’s Terminal Tuts, we are going to present yet another powerful system process monitoring command ‘htop’, which in Linux is a command-line utility that enables users to interactively monitor important system processes in real-time.
The command was developed by Hisham Muhammad 15 years ago as a replacement for its older brother, top, and was released in May 2004. Yet many Linux users are still not aware of the powerful utility nor its usefulness as a system monitor and process viewer.
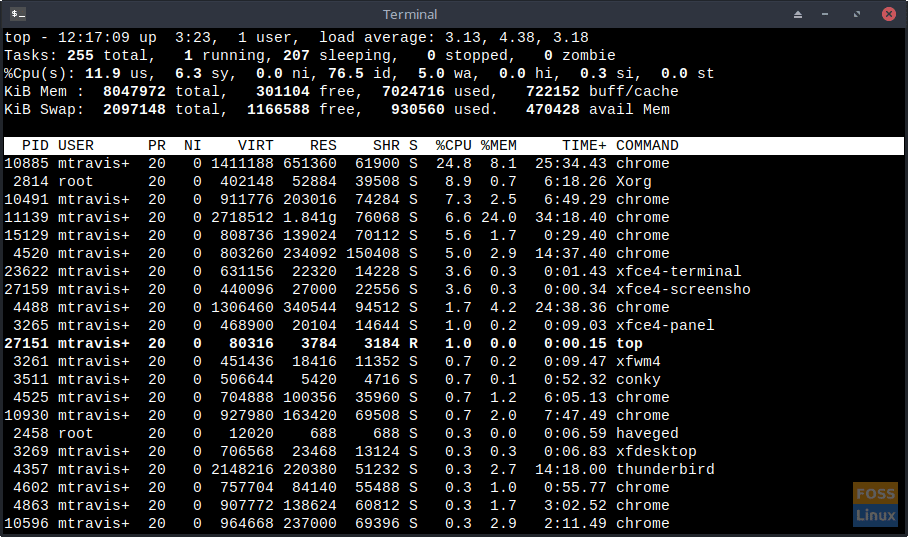
The top Command In Action
The top has been a mainstay in the Unix/Linux community since 1984 (over 35 years), But, in this Linux user’s opinion, has overstayed its welcome. htop is the new kid on the block, and it is powerful.
htop command advantages
You can interactively monitor your system’s vital resources or processes in real-time. The color used in its output makes it much more comfortable to read than does the monochrome top output.
The only benefit I can see in using top is that it is older and thus more tested and tried. But, I am more than comfortable with the stability of a 15-year-old Linux utility.
- supports mouse operation
- allows you to scroll both horizontally and vertically, allowing you to see all processes and complete command lines
- allows you to kill a process without knowing the PID (in top, you must specify the PID).
- starts faster, while top seems to delay a bit while collecting data.
- top requires you to type the PID or priority value to alter the scheduling priority or renice a process, while the latter does not
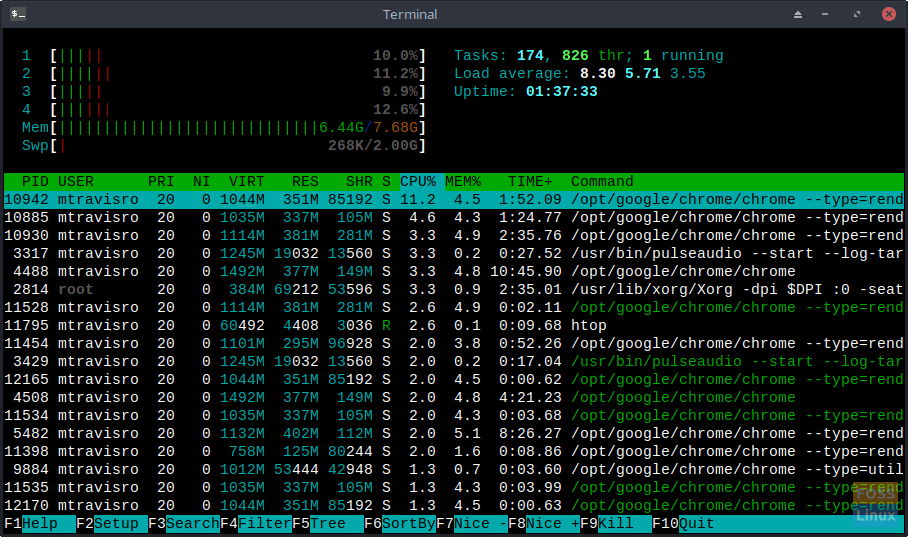
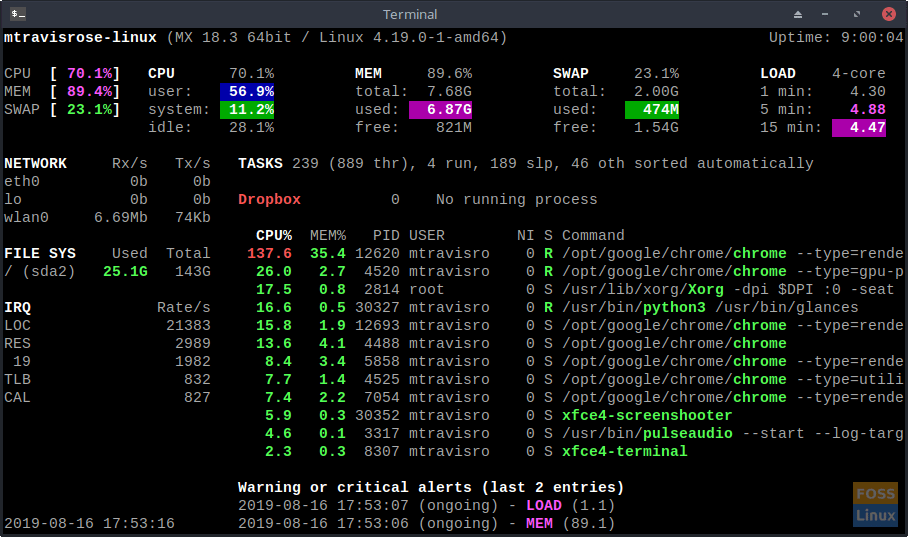
HTOP In Action
htop command usage
The command is easy to invoke from the command prompt:
# htop
The command usage is divided into three parts.
In the first part (upper-left corner), we see bar-like gauges that show our processor usage, memory in use, and swap memory in use, respectively.
The second part (upper-right corner) shows us standard information, such as a task summary, load average, and uptime.
The last section is the bottom where you will see 12 columns. They are:
- PID – process ID
- USER – username of the process owner (or user ID if the name can’t be determined)
- PRI – internal priority of the kernel for the process
- NI – nice value of a process — from low priority, 19 to high priority, -20
- VIRT – size in memory of total program size
- RES – resident set size
- SHR – size of the process’s shared pages
- S – state of the process (S – sleeping/idle, R – running, D – disk sleep, Z – zombie, T – traced/suspended)
- W – paging
- CPU% – percentage of CPU time process is currently using
- MEM% – percentage of memory process is currently using
- TIME+ – time (measured in clock ticks process has spent in user and system time)
- Command – full path of the command
As with most Linux commands, there are options too.
# htop [-dChusv]
- –d – delay (shows the delay between updates (in tenths of seconds))
- –C – no-color (monochrome mode)
- –h – help (display the help message and exit)
- –u – user=USERNAME (show only the processes of a given user)
- –h – pid=PID, (show only the given PIDs)
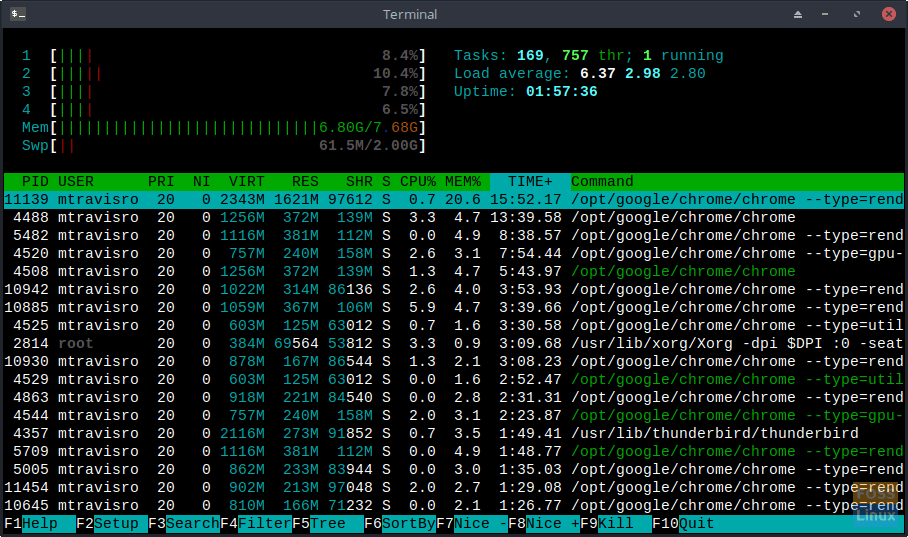
- –s – sort-key COLUMN (Sort by this column)
- –v – version (output version information and exit)
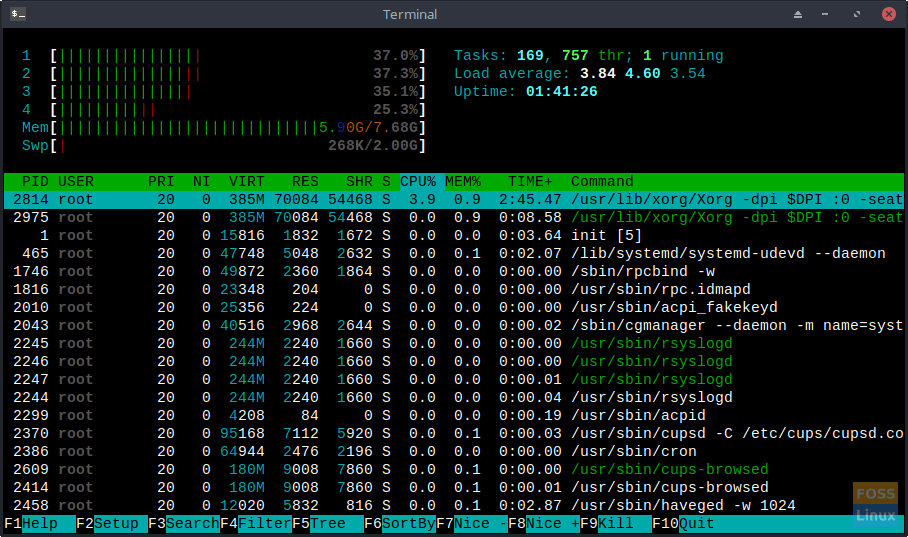
– root processes only
You can also use the interactive commands you can use while the command is running to change the sort/look of your window. These are:
- Arrows, Page Up, Page Down, Home, End– scroll the process list
- Space – tag or untag a process
- U – untag all processes
- s – trace process system calls
- F1 – Help
- F2 – setup
- F3 – search
- F4 – filter
- F5 – tree view
- F6 – sort
- F7 – increase the selected process’s priority
- F8 – decrease the selected process’s priority
- F9 – kill process
- F10 – quit <Esc> also works

sorted by time
One can also sort the columns simply by using the mouse, too.
-u in Action
This wonderful command not only proven instrumental in helping me locate memory leak issues over the years, but also helped me find recently installed programs that are hogging my CPU.
We encourage both new and experienced Linux users alike to use the man command to view all the features that the command provides.
# man htop
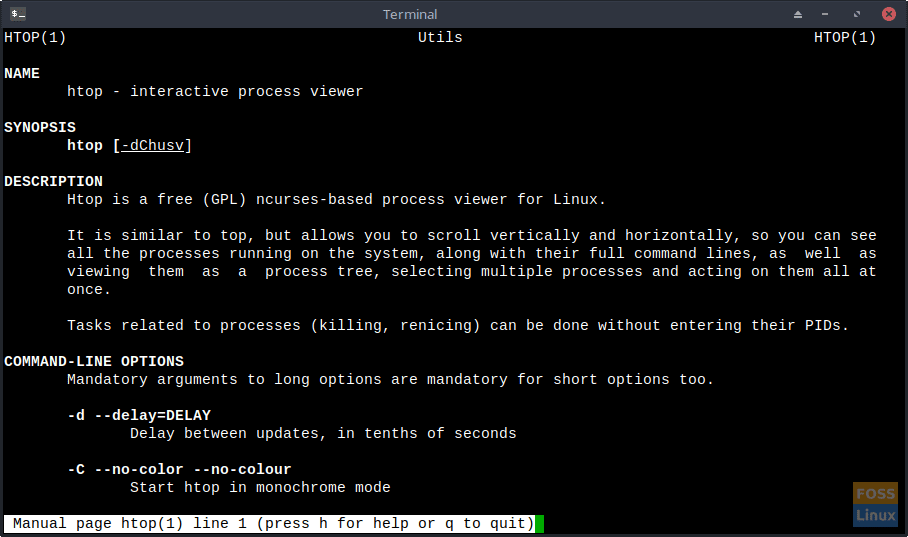
man page
Not only is the command an invaluable utility for the veteran Linux user’s toolkit, but it is also useful for the new Linux user to gain a better understanding of how Linux works and discover “what’s under the hood.”
Similar utilities that I have used in troubleshooting include both atop and glances. Look forward to future articles on those utilities soon.
Glances in Action
There is so much more to explore with this tool then what I’ve included in this article. Please give it a try. You’ll be glad you did.