
NGINX amplify is a tool that monitors performance, enables real-time examination and helps to fix problems linked with running and scaling of websites, and tracking of systems running within the NGINX.
The NGINX Amplify Agent is written in Python and works with Python 2.6 and 2.7. It doesn’t work with Python 3.0 as of today. Here is the list of supported Linux distributions:
- Ubuntu
- Debian
- RHEL/CentOS/OEL 6
- RHEL/CentOS/OEL 7
- Amazon Linux 2017.09
The application helps in the visualization and determination of NGINX web servers and problems associated with their performance, overloaded servers, or potential Denial of Service Attacks (DDoS). NGINX application helps in the optimization of the server’s performance recommending solutions as necessary.
Other glorious functions of the NGINX reporting tool are sending an alert when something is wrong with any of the setup applications and serves as a web capacity and performance planner. Generally, the NGINX amplify structure have the following three components:
1. The Amplify Backend
It is a core component that implements as Software as a Service (SaaS). Its work is to incorporate scalable metrics, a database, core Application Programmers Interface (API), analytical engine, and an analytics engine.
2. The Amplify Agent
This Python application needs installation and runs on monitored systems. The ongoing communication between the agent and SaaS backend are over SSL/TLS where the agent automatically initiates all the traffic.
3. The Amplify Web User Interface (UI)
It is a user interface that supports all other browsers and is accessible via TLS or SSL tunnels.
You can introduce a user-defined dashboard by offering a statistic analyzer to improve the reporting ability of the NGINX.
Installing Amplify Agent on Linux
The first step in installing the Amplify agent is to sign up and create an account. You will after that get an email with a verification link. Click on that link and log into your account. Follow the instructions as shown
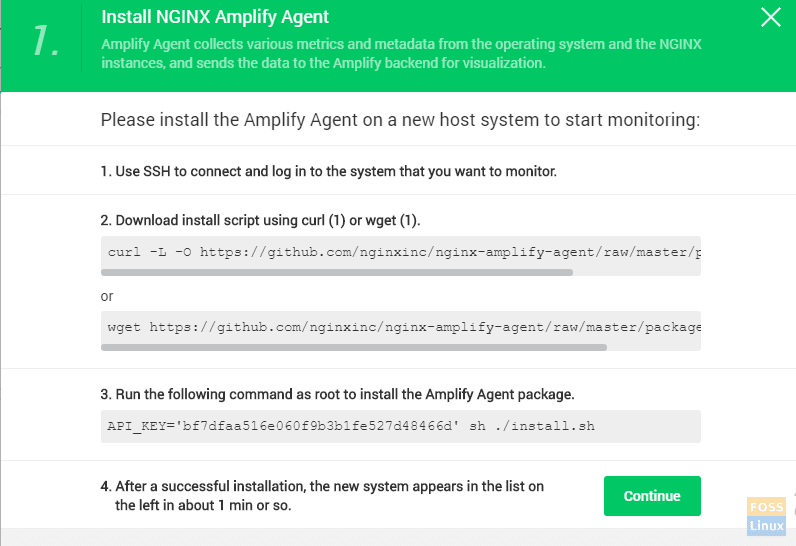
Download the NGINX install script and use curl or wget command.
# wget https://github.com/nginxinc/nginx-amplify-agent/raw/master/packages/install.sh
OR
# curl -L -O https://github.com/nginxinc/nginx-amplify-agent/raw/master/packages/install.sh
Run the command using the sudo command to initiate the API_KEY, which is unique and different for every machine introduced into the system.
# API_KEY='bf7dfaa516e060f9b3b1fe527d48466d' sh ./install.sh
Note that there may be an error indicating that sub_status is not configured. (This process should complete in the next installation phase).
Once you are done, go to the web’s user interface, and wait for at least a minute and you will see the new system on the left side of the screen.
Configure the stub_status in NGINX
Open the stub_status to build NGINX graphs. For NGINX plus users, they need to configure the stub_status or the extended_status module. A new configuration file is created using the command line as shown below
# sudo vi /etc/nginx/conf.d/sub_status.conf
Then copy the following stub_status configuration file inside the fileserver
 {
listen 127.0.0.1:80;
server_name 127.0.0.1;
location /nginx_status {
stub_status;
allow 127.0.0.1;
deny all;
}
}
Save and close the file.
Restart the NGINX server services to make the stub_status
# sudo systemctl restart nginx
Configure Additional NGINX Metrics for Metrics
The next thing to do is to set up additional NGINX metrics to help in monitoring performances. Head out to
etc/nginx/nginx.conf
Add the following code
log_format main_ext '$remote_addr - $remote_user [$time_local] "$request" '
                                '$status $body_bytes_sent "$http_referer" '
                                '"$http_user_agent" "$http_x_forwarded_for" '
                                '"$host" sn="$server_name" ' 'rt=$request_time '
                                'ua="$upstream_addr" us="$upstream_status" '
                                'ut="$upstream_response_time" ul="$upstream_response_length" '
                                'cs=$upstream_cache_status' ;
Next, edit the access_log and error_log to be as follows
access_log /var/log/nginx/suasell.com/suasell.com_access_log main_ext;
error_log /var/log/nginx/suasell.com/suasell.com_error_log warn;
Restart NGINX services for the changes to take place
# sudo systemctl restart nginx
Start the Monitoring Process Via Amplify Agent
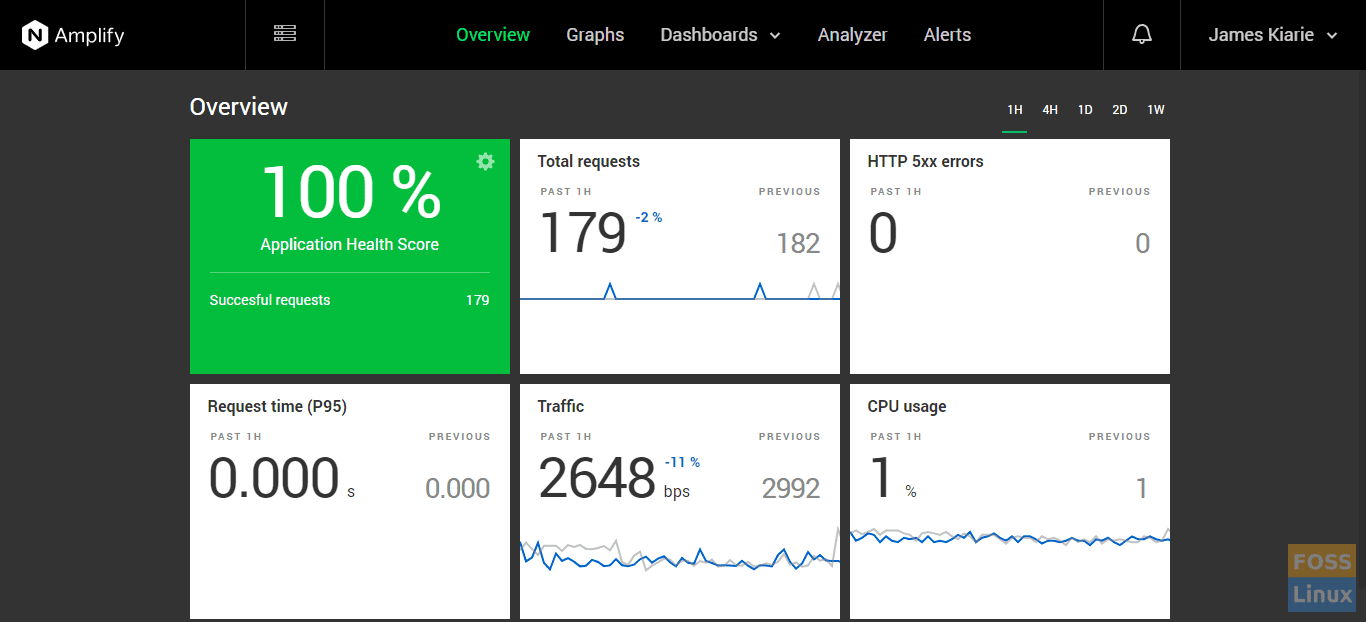
Finally, you can start monitoring your Nginx web server. Head out to your browser on the Amplify page and click on overview as shown.
Overview
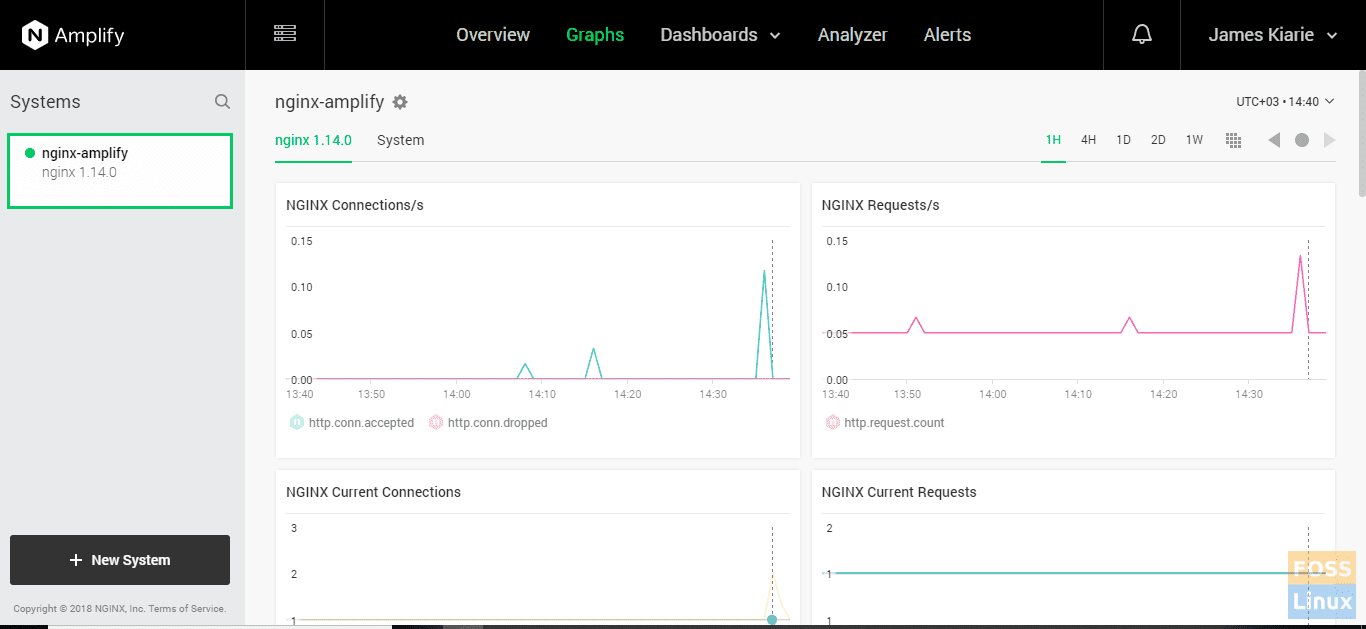
To get more detailed statistics, click on the ‘Graphs” tab
That’s all we had for today. Feel free to try out the tool!
1 comment
FYI, a better fork of this client exists at https://github.com/abraunegg/onedrive/blob/master/docs/INSTALL.md