
Do you want to monitor the performance of your Linux system? Are you looking for some powerful performance monitoring tools to help you out? If you agree, it’s your day as we have put together a detailed list of the ten best Linux performance monitoring tools. Performance monitoring tools can help users check on how much system resources are being used and which apps are consuming what percentage of it. This helps the user to properly manage the applications and make sure that the system is in good health.
Best Linux Performance Monitoring Tools
Not only will we showcase the best tools for the job, but also show you how to install them on your Linux PC. And don’t worry as all the tools mentioned here will run on all Linux Distros, including yours.
1. Top
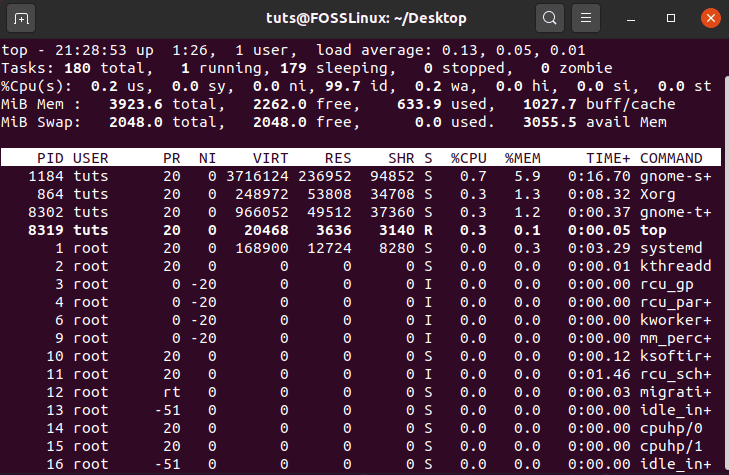
Top Command
Top is the classic Linux task manager found on most Unix-like operating systems. Launching the command will display a list of all the running processes and their resource consumption categorized into separate columns.
It gives you a clear view of how much CPU and RAM the system processes are using in real-time. If you wish to kill a specific system processor on the list, then you can simply press “K” and then specify the process id (the tool also shows the PID). If you are authorized to stop the process, then it will get killed after you hit enter.
How to Run
Almost all Linux distros will be able to run the ‘Top’ command right out of the box. It comes bundled in with the core utility packages that get installed along with Linux.
To run the ‘Top’ command on your system, just type this in your terminal and hit enter:
$ top
For more information, you can check out this article.
2. GkrellM
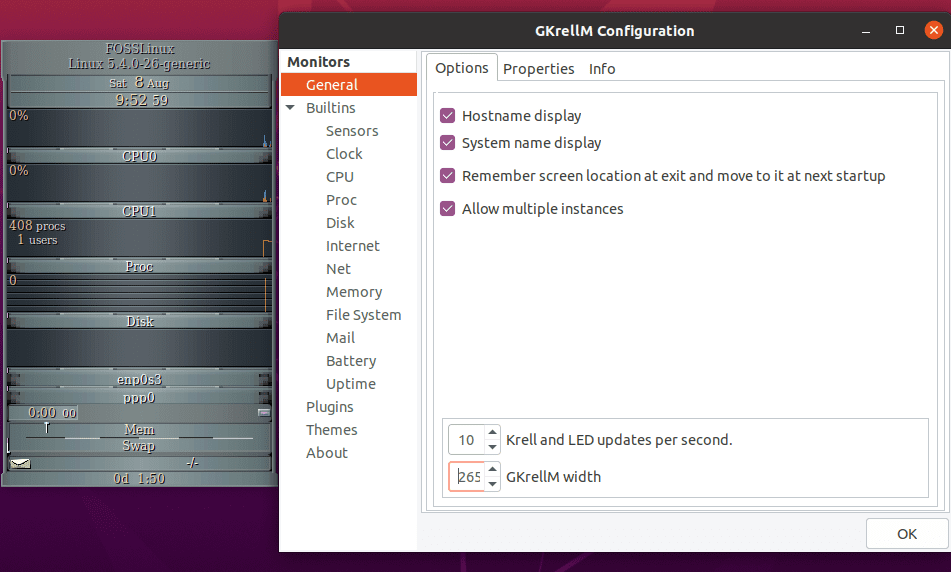
GKrellM
GKrellM is a GTK + Toolkit based performance monitoring tool that can help you monitor various system resources in real-time.
It gives you access to a stackable UI – meaning you can put as many monitoring objects you like on top of one another. Furthermore, you can configure it to “stay on top of other windows,” so you can always monitor the usage statistics.
By default, GKrellM can help you monitor all the basic objects like CPU usage, memory usage, network bandwidth, etc. However, you can add additional plugins to monitor external applications. The tool also supports themes that you can use to customize and match its appearance to your window manager, GTK, and even your desktop environment.
How to Install
Ubuntu users can easily install GkrellM by entering the following command in the terminal:
$ sudo apt install gkrellm
If you are on any other distro, you can visit the official GKrellM website for download/install information.
3. Tcpdump
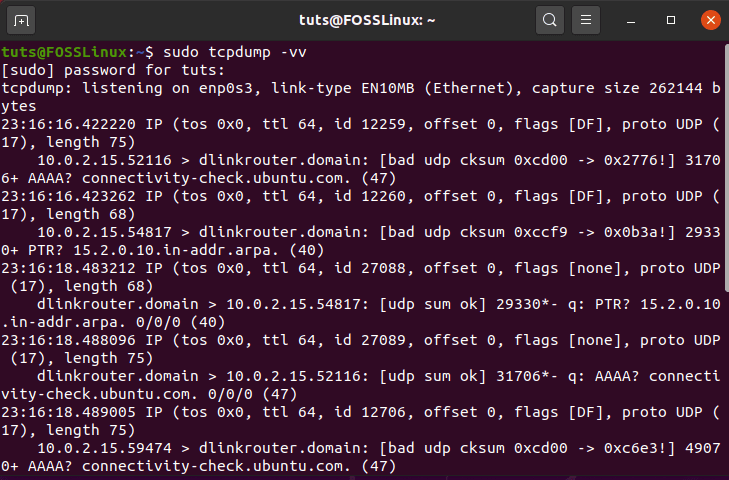
Tcpdump Command
Tcpdump is classified as a network packet analyzer, rather than a performance monitoring tool. However, it is a useful app that can come in handy when you are trying to diagnose network packets that are causing performance bottlenecks.
It is one of the most popular command-line tools used for capturing TCP/IP packets that are either transferred or received over a network on a specific interface.
Using specific commands, you can use the tool to show various information about the packet content. For example, you can command the tool only to capture packets that are going through a particular port, capture packets belonging to a specific protocol, or even capture TCP communication happening between two specified hosts.
How to Use
Tcpdump comes loaded with all major Linux distributions. Here are a few example commands showing you how to use it on your system:
# tcpdump -i eth0 not port 22
# tcpdump -c 10 -i eth0
# tcpdump -ni eth0 -c 10 not port 22
# tcpdump -w aloft.cap -s 0
# tcpdump -r aloft.cap
# tcpdump -i eth0 dst port 80
For more details, visit their official website.
4. Monit

Monit
Next up, we have Monit – a web-based free and open-source performance monitoring tool. It can be used to keep an eye on different aspects of your system, including files, directories, filesystems, permissions, programs, checksums, and all other system processes.
You can view the system status straight from your command line, or through the dedicated web interface. The tool can be programmed to repair and execute specific actions in error situations automatically. The app can even send an alert email to the system admin specifying the error so that immediate action can be taken.
How to install
Ubuntu users can easily install Monit using the apt-get command, as shown here:
$ sudo apt-get install monit
Users on other Linux distros will need to enable the third-party Epel repository to install the tool. Once Monit is installed, you will need to configure it and then add programs that you want to monitor using the tool. Detailed instruction on how to do this is available on their official website.
5. Collectl
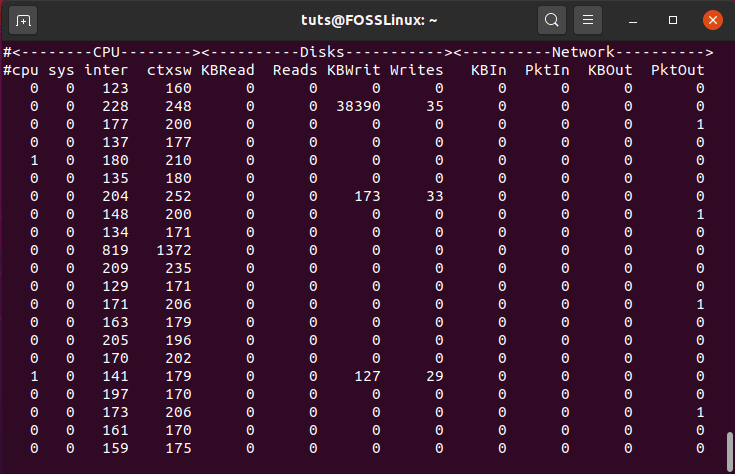
Collectl
Collectl is another powerful command-line tool that functions as an all-in-one performance monitoring tool. You can run it as a command to gather information on resource consumption. This includes things like CPU usage, disk usage, network bandwidth, etc.
The cool thing about the tool is that you can either use it in an interactive mode or have it passively write usage reports to your disk where you can review and analyze them later. You can even access the saved stats through a web server for more convenience.
How to Install
If you are on Ubuntu, you can easily install Collectl using the following command:
$ sudo apt install collectl
Other distro users will need to install the third-party Epel repository, which contains the tool. For more details, visit their official website.
6. SAR
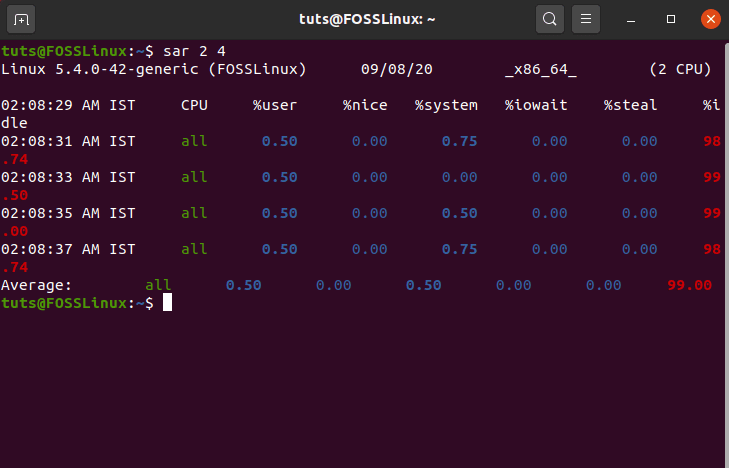
SAR Command
SAR stands for System Activity Reports and is used for real-time system monitoring. It is an excellent command-line tool that you can use to monitor performance and check for bottlenecking issues.
You can either have the tool display the server usage data presented to you in real-time or gradually collect it in the background. You can later access the historical data to analyze how the system performs over time. When using SAR, you can specify specific parameters, and it will record the usage statistics based on it.
How to Install
SAR is a part of the Sysstat package. As such, you will first need to install Sysstat on your system before using SAR. Once installed, you will have to enable Sysstat as well as the SAR data collection feature, before you can use the tool. You can check out this GitHub page of SAR for more details. Also, check out their official website for more information.
7. Htop

Htop
Htop is a ncurses-based process viewer and is essentially a more improved and advanced version of the Top command we discussed earlier.
Functionality wise, it builds on the same feature set that you get with the Top command but adds extra bells and whistles, including an intuitive and interactive UI, shortcut-key support, vertical and horizontal view for processes, and much more.
The layout is divided into three sections – head, body, and foot, which is used to categorize and present all system resource and usage statistics. And the best part is that you can navigate through all the data using your mouse – something that was impossible to do with Top.
How to Install
Htop is a third-party tool and doesn’t come bundled in with most Linux distros like the ‘Top’ command. As such, you will need to install it separately onto your system. If you are on an Ubuntu-based system, you can enter the following command to install it:
$ sudo apt-get install htop
However, if your distro’s package manager doesn’t have Htop, then you will need to install it using the binary packages. For this, you can reference their official website. Also, you can check out our tutorial to learn how to use htop commands.
8. Nagios
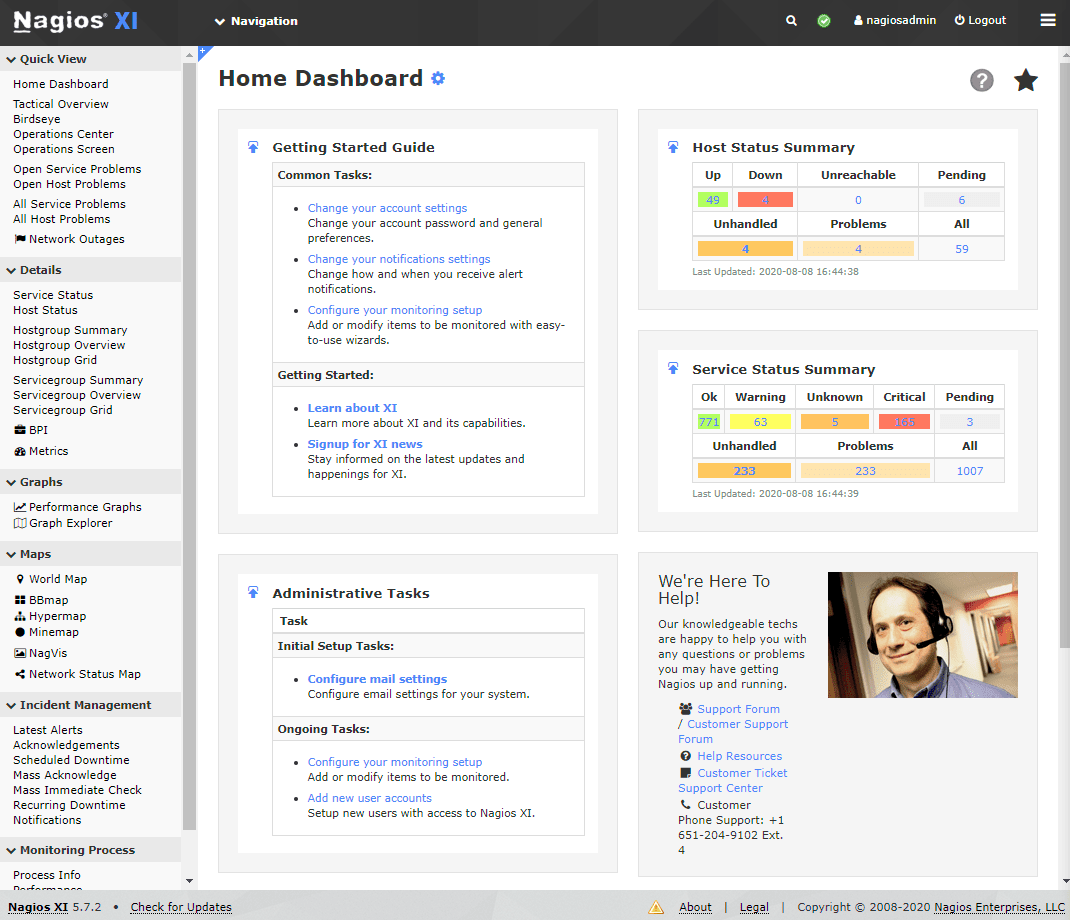
Nagios
Nagios is a top-rated and powerful open-source system monitoring tool that can help you keep an eye on pretty much any system resource. Network and system administrators use Nagios all the time to identify and resolve network-related issues before it can cause any nuisance.
The tool comes with a daemon that collects information on various processes, either running on your system or a remote host. You will be able to monitor anything from remote Linux and Windows systems to Routers, Printers, etc.
Once collected, all the information is then neatly represented in a user-friendly web-based interface. You can set critical thresholds for various services running on the server. As soon as the limit is exceeded, the tool will generate a warning, so that the system admin or the technical team can quickly pitch in and fix it.
How to Install
Installing and configuring Nagios is a bit more complex and complicated compared to the other tools on the list. As such, we have included a link to the official installation guide for Nagios to help you out. You can also visit their official website for additional information.
9. Stacer
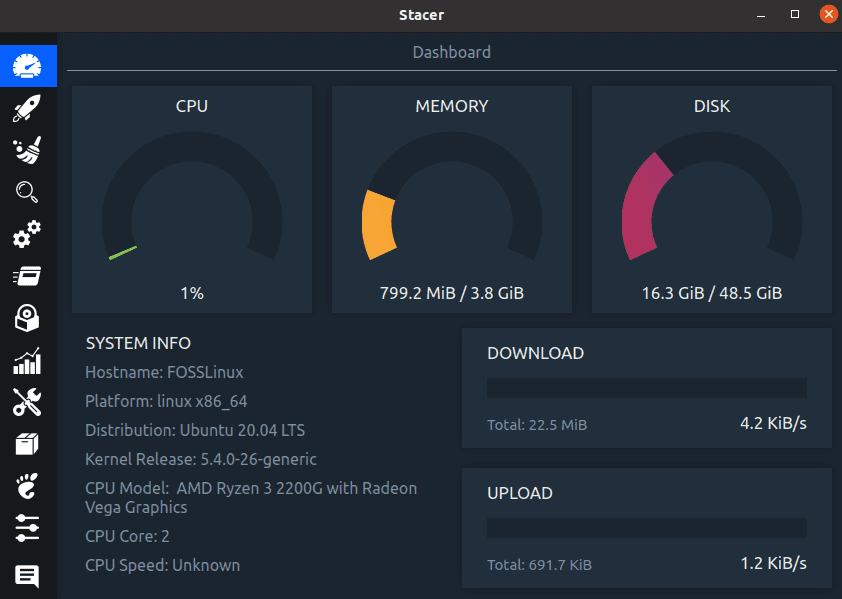
Stacer
Stacer is a feature-rich tool for performance monitoring and system optimization. It comes with a clean and modern GUI, including a heads-up display showing you all the crucial usage statistics for your CPU, Memory, Disk, as well as Upload and Download speeds for your internet connection.
You can also use the tool to monitor different system services and processes. There is even an option to enable/disable them directly from the app.
Overall, the app is powerful and worth having for both system administrators as well as casual users. And the fact that it is entirely free to use just adds to the delight.
How to Install
If you are running Ubuntu, you can download the app by entering the following command in your terminal:
$ sudo add-apt-repository ppa:oguzhaninan/stacer -y
$ sudo apt-get update
$ sudo apt-get install stacer -y
However, if you are using a distro other than Ubuntu, then you can visit their GitHub Page for distro-specific instructions on installation.
10. The Performance Monitoring Tools That Comes with Your Desktop Environment
Finally, for the average and casual Linux users, we would recommend to try out the performance monitoring tools that come built-in with your desktop environment.
It is worth mentioning that these are much more rudimentary compared to some of the advanced monitoring tools mentioned on the list. But then again, it comes pre-installed, and you don’t have to configure it separately or download any other dependencies or packages to run it.
Furthermore, if all you need is surveillance over the basic system resource usage, then these tools are more than sufficient. Now, there are tons of Linux desktop environments out there in the market. But for the sake of demonstration, we have only included the two most popular options – GNOME and KDE.
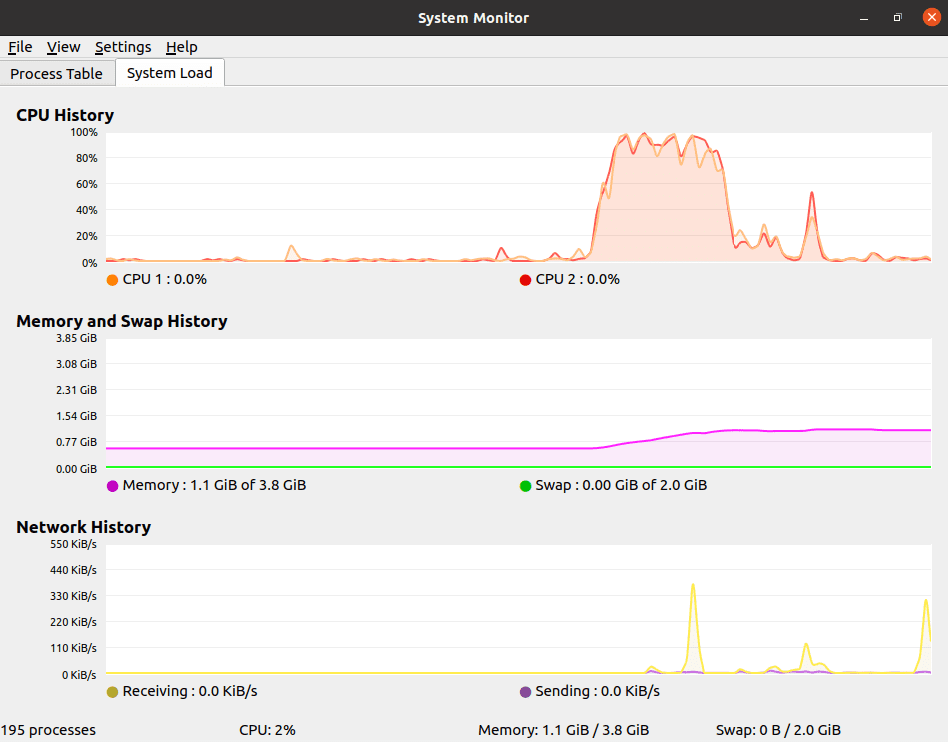
GNOME System Monitor
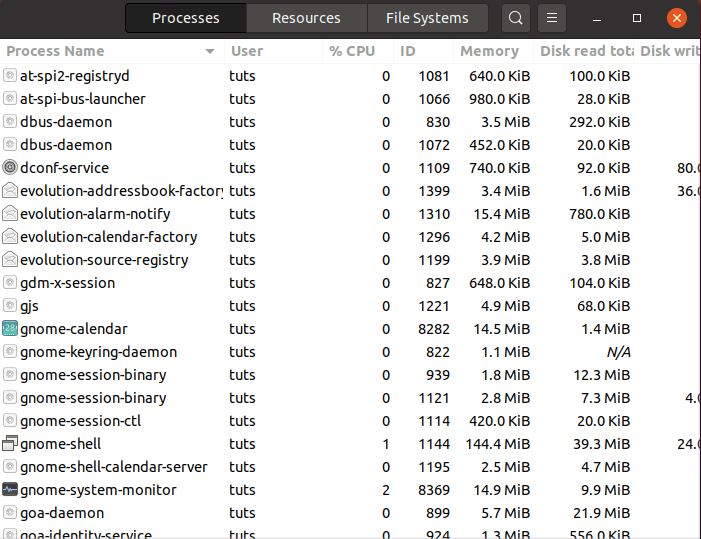
GNOME System Monitor
The GNOME System Monitor is available with any Linux distro that runs; you guessed it – GNOME. It gives you access to a graphical interface for monitoring the different processes running on your system, the system resources, and the file systems.
Apart from using it to monitor your resource consumption, it can also help you kill processes and even change the priority of a process.
To find the GNOME system monitor, log in to your GNOME powered Linux PC and head on over to System > Administrator > System Monitor. You can also type in the following command in the terminal to launch it:
$ gnome-system-monitor
KDE System Guard
KDE System Guard or KSysGuard
And then, for Linux distros running KDE, we have KDE System Guard, also known as KSysGuard. It is a much more advanced option compared to what GNOME has to offer. With KDE System Guard, you can monitor not only the local system but also any remote system that you have access to. Not just that, but the tool represents all the statistics in graphical format, which is a pleasure to look at.
Now to open the KSysGuard, you will need to first log in to your KDE powered Linux PC and then navigate to System > Administrator > System Monitor.
Or, you can enter the following command in the terminal:
$ ksysguard
Note: Even though these tools come pre-installed with their respective desktop environments, they are not confined to these desktop environments only. As such, you are free to install GNOME System Monitor on a Linux PC running KDE, and vice versa.
Wrapping Up
So these were our picks for the best Linux performance monitoring tools. We hope the list was useful and that it helped you in finding the right tool to keep an eye on your system usage and resource consumption. As you can see, we have made sure to keep a diverse variety of tools and apps.
From apps that come pre-built with your Linux distro, to third-party options, we have included it all. Some of these apps come with their own GUI, some are web-based, and others are lightweight command-line utility tools. You will also find a variety of the features and functionalities they bring to the table. With all these options, you are sure to find the perfect performance monitoring tool for Linux that fits your specific needs and requirements.
1 comment
What about Checkmk? The tool is available as a Raw Edition, which is 100% open-source and free, and as an Enterprise Edition with a many additional enterprise features.
I think Checkmk belongs to the best Linux monitoring tools and should be mentioned in that article to make it complete. What do you think? Can you have a look at Checkmk?