
Grafana is an open-source metric analytics and visualization software. It is a feature-rich metrics dashboard suite that is used widely as a graph editor for Graphite, Elasticsearch, OpenTSDB, Prometheus, and InfluxDB.
Typical Grafana usage includes infrastructure and application analytics, but it’s also applied in other domains including industrial sensors, home automation, weather, and process control.
Installing and Configuring Grafana on CentOS 7
Launch Terminal and login as root.
Step 1 – Disable SELinux
The first step is to check the SELinux status and disable it if it is enabled.
getenforce
Modify SELinux configurations as follows:
vim /etc/sysconfig/selinux
Change SELINUX=enforcing to SELINUX=disabled
Reboot system.
reboot
There are few methods to install Grafana on RPM-based Linux Distributions like Centos /Fedora. In today’s tutorial, we are going to install from Grafana repository.
Step 2 – Installing Grafana via YUM Repository
Create a repo file.
vim /etc/yum.repos.d/grafana.repo
Add the following contents to file:
[grafana]
name=grafana
baseurl=https://packages.grafana.com/oss/rpm
repo_gpgcheck=1
enabled=1
gpgcheck=1
gpgkey=https://packages.grafana.com/gpg.key
sslverify=1
sslcacert=/etc/pki/tls/certs/ca-bundle.crt
Step 3 – Install Grafana
Enter the following command:
sudo yum install grafana
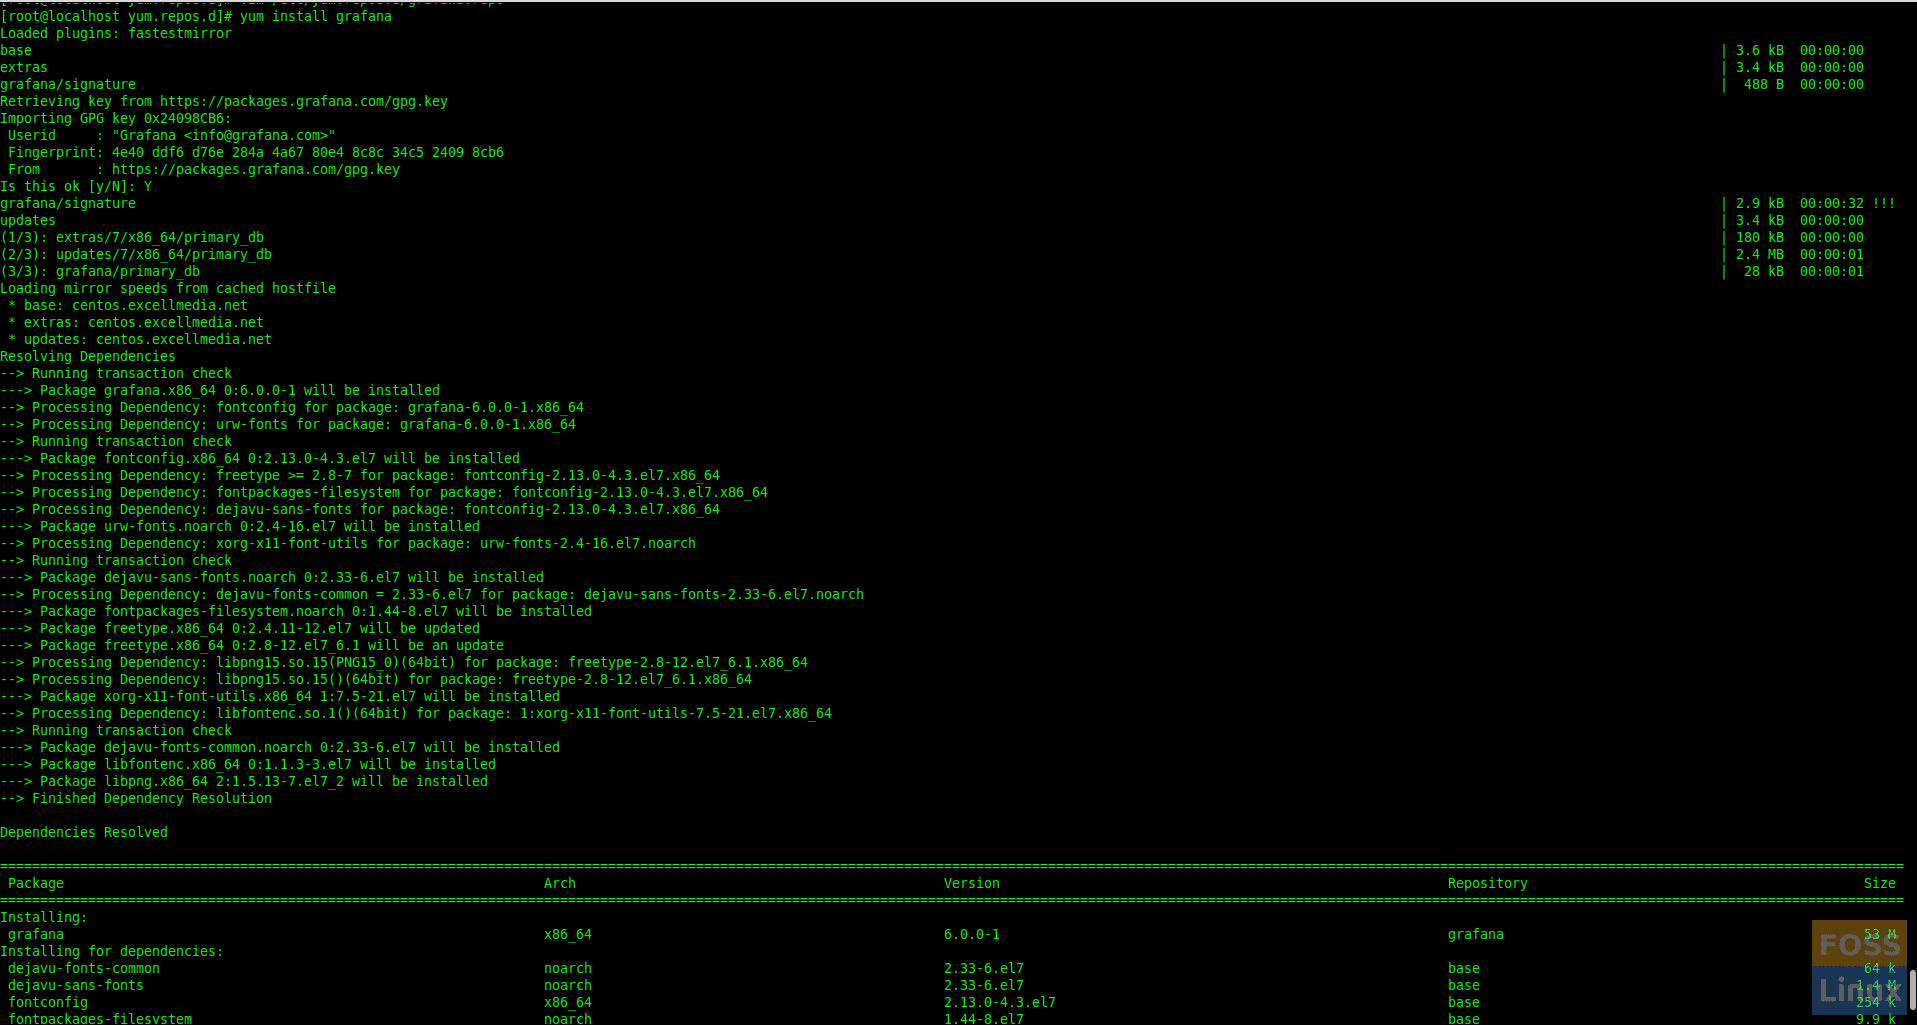
Install Grafana
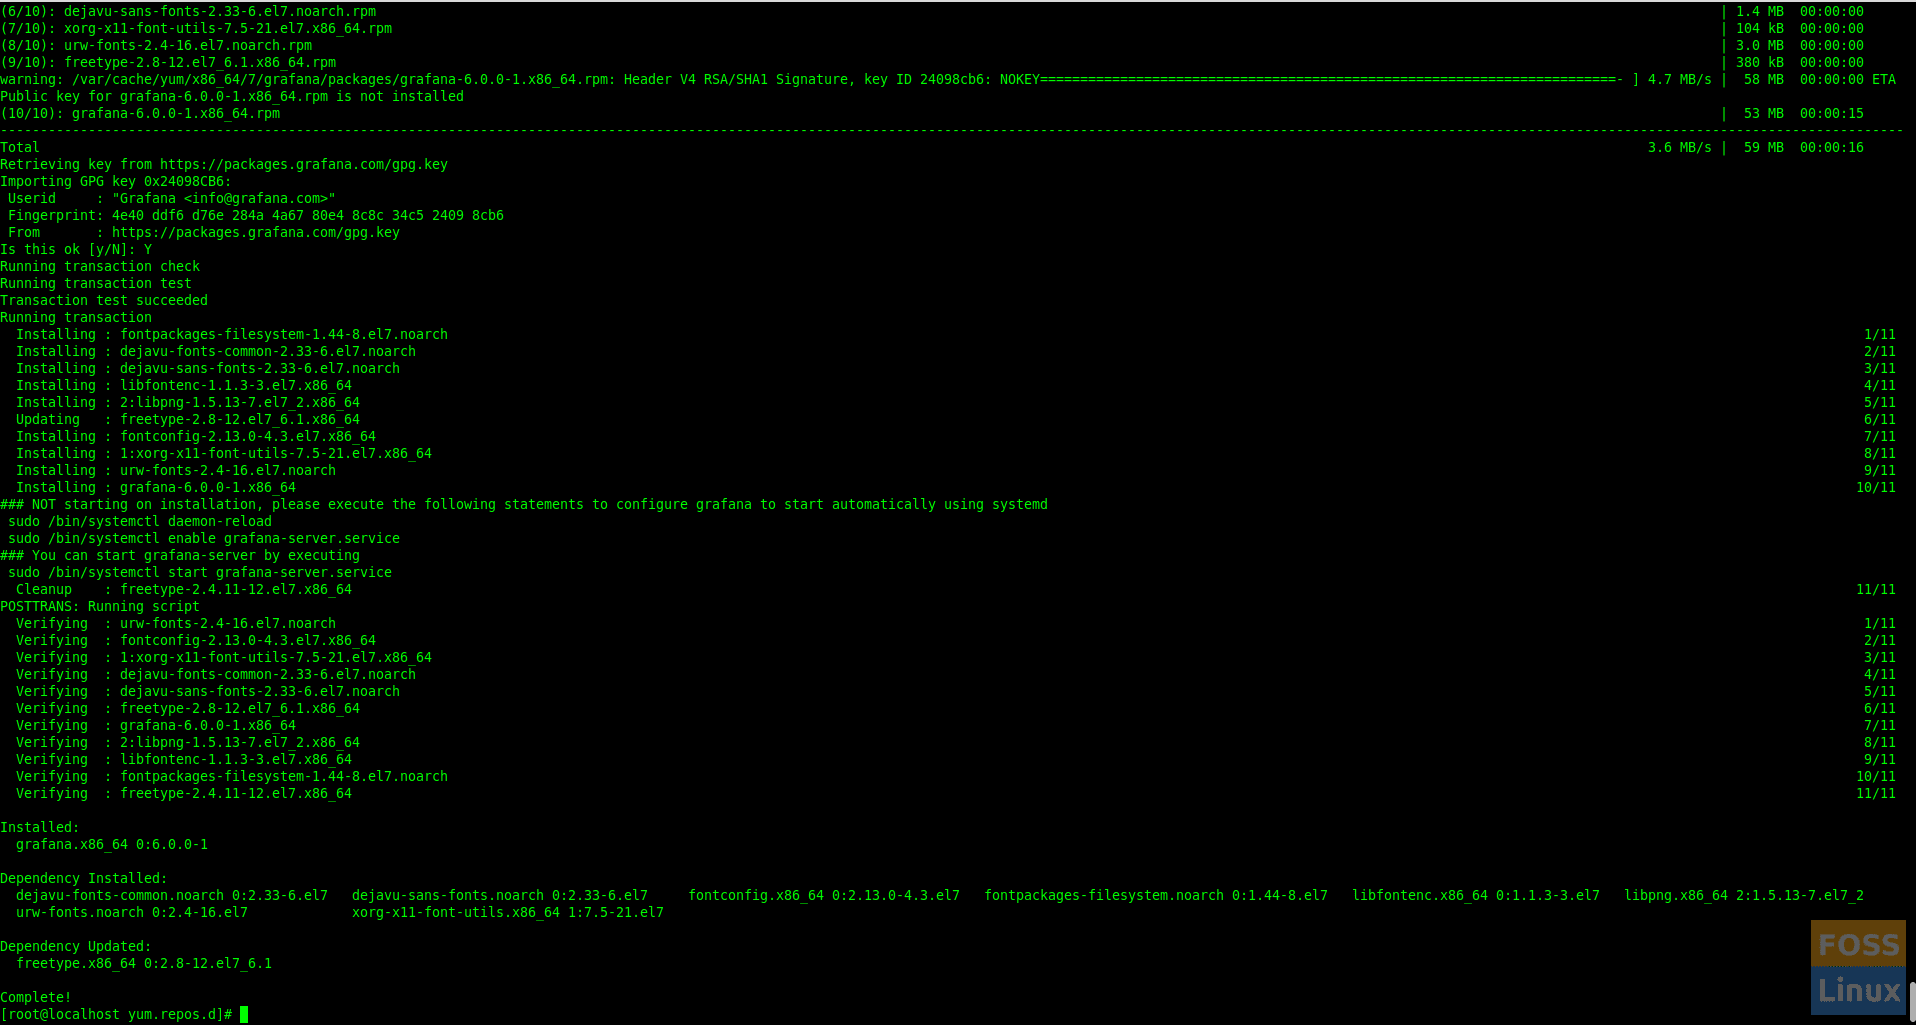
Completed Installation
The Package does the following things:
- Installs binary to /usr/sbin/grafana-server
- Copies init.d script to /etc/init.d/grafana-server
- Installs default file to /etc/sysconfig/grafana-server
- Copies configuration file to /etc/grafana/grafana.ini
- Installs systemd service (if systemd is available) name grafana-server.service
- The default configuration uses a log file at /var/log/grafana/grafana.log
Step 4 – Install additional font packages
Continue with following commands to install the free type and urw fonts.
yum install fontconfig
yum install freetype*
yum install urw-fonts
Step 5 – Enable Grafana Service
Check the status of the service.
systemctl status grafana-server
If service is not active, start it using the following command:
systemctl start grafana-server
Enable Grafana service on system boot
systemctl enable grafana-server.service
Step 6 – Modify Firewall
Change firewall configuration to allow Grafana port. So run following command.
firewall-cmd --zone=public --add-port=3000/tcp --permanent
Reload firewall service.
firewall-cmd --reload
Step 7 – Browse Grafana
Use the following URL to access the Grafana web interface.
http://Your Server IP or Host Name:3000/
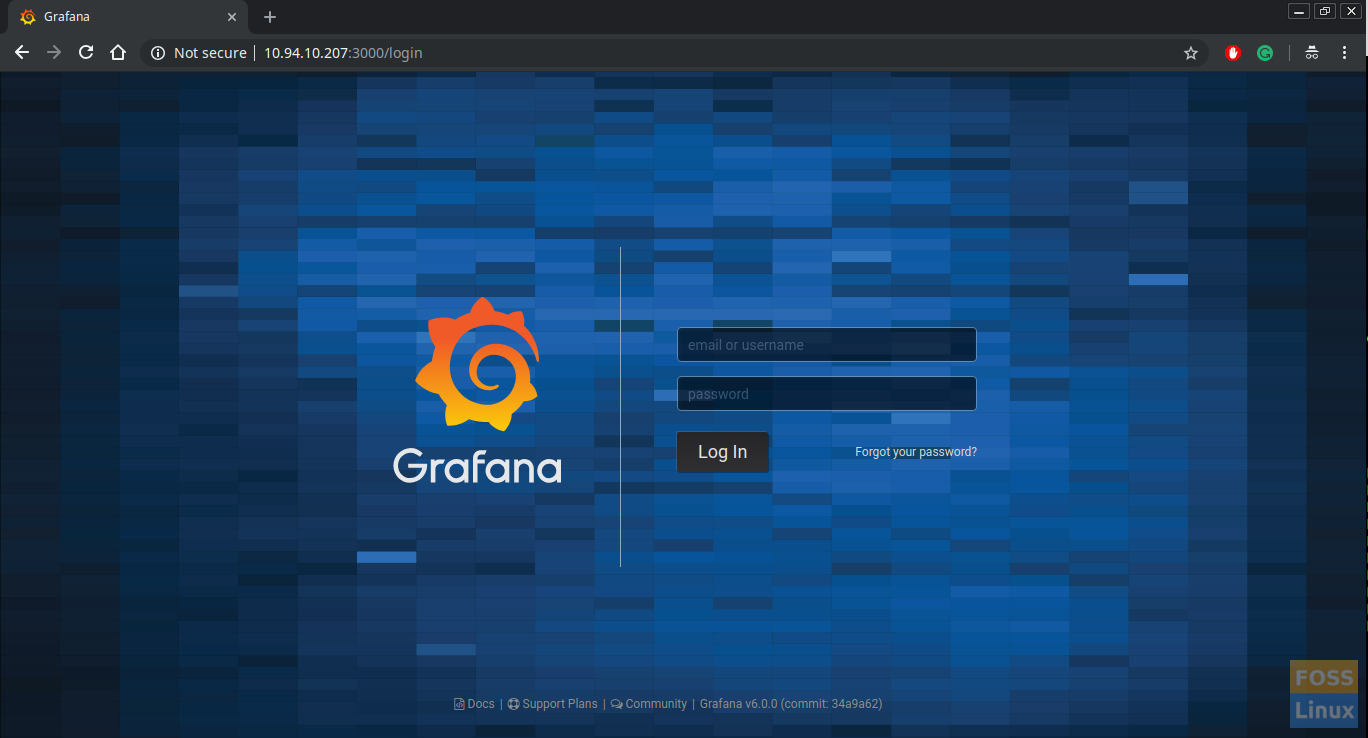
Grafana Login Page
Enter “admin” in the login and password fields for first-time use; then it should ask you to change the password.
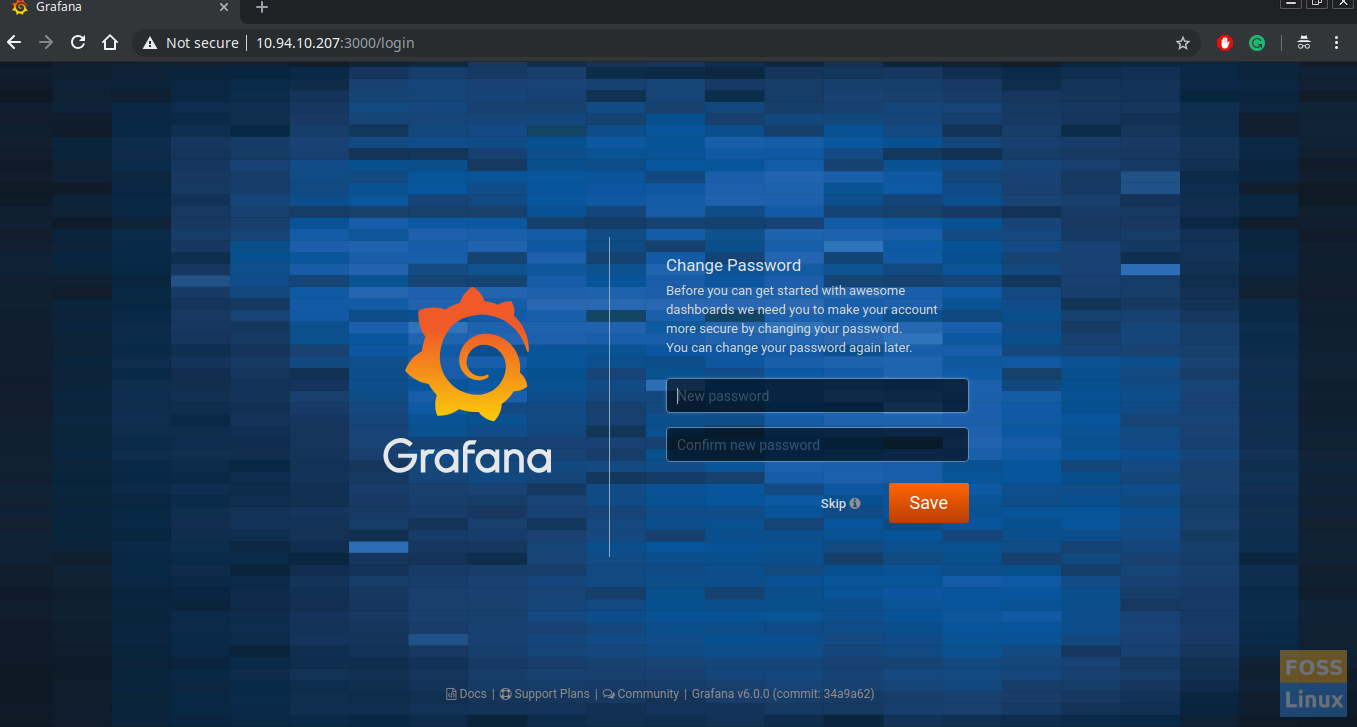
Change Password
It should redirect to the Dashboard.
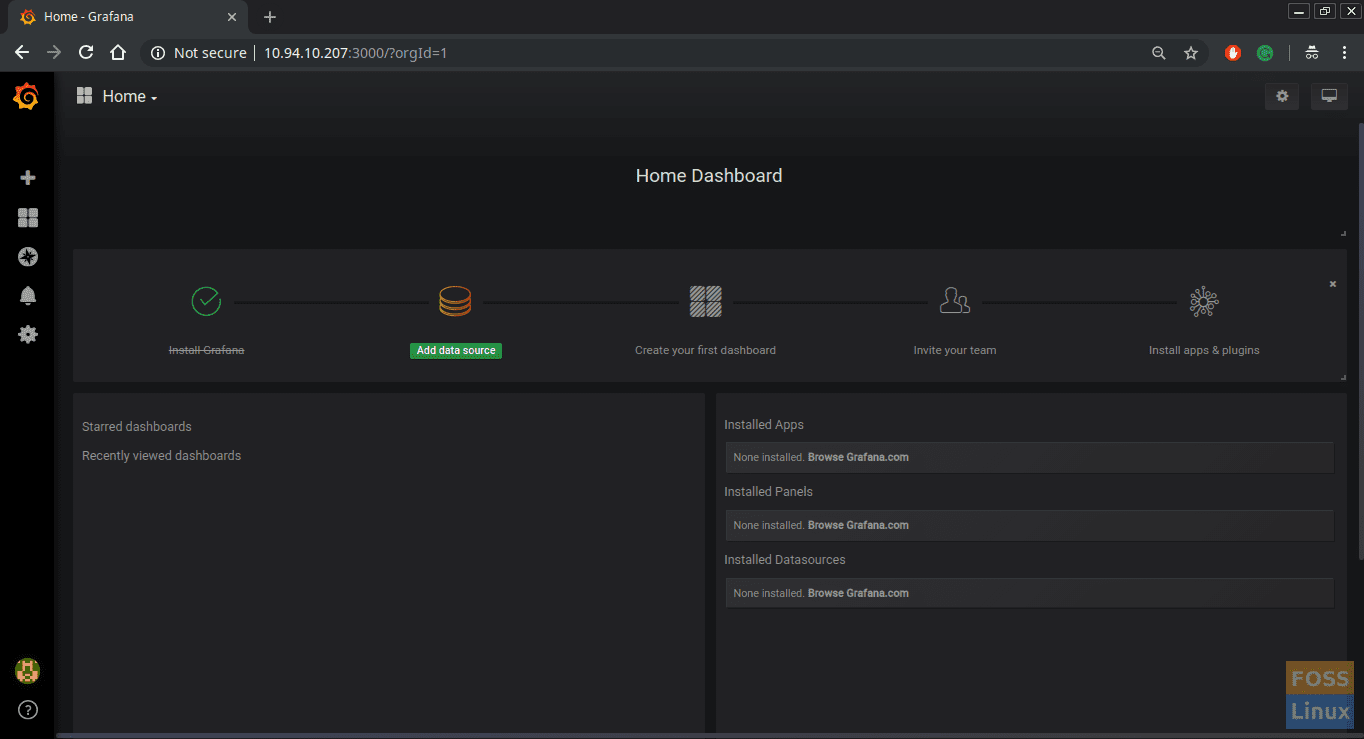
Grafana Dashboard
In the previous article, we learned how to install Zabbix. So here we are going to add Zabbix Plugin to Grafana.
Step 8 – Install Plugins
To Install Zabbix plugin run following command:
grafana-cli plugins install alexanderzobnin-zabbix-app
Default plugin installation directory is /var/lib/grafana/plugins. Restart Grafana Service.
systemctl restart grafana-server
Refresh Grafana Dashboard to see Zabbix plugin. Click “Enable Now.”
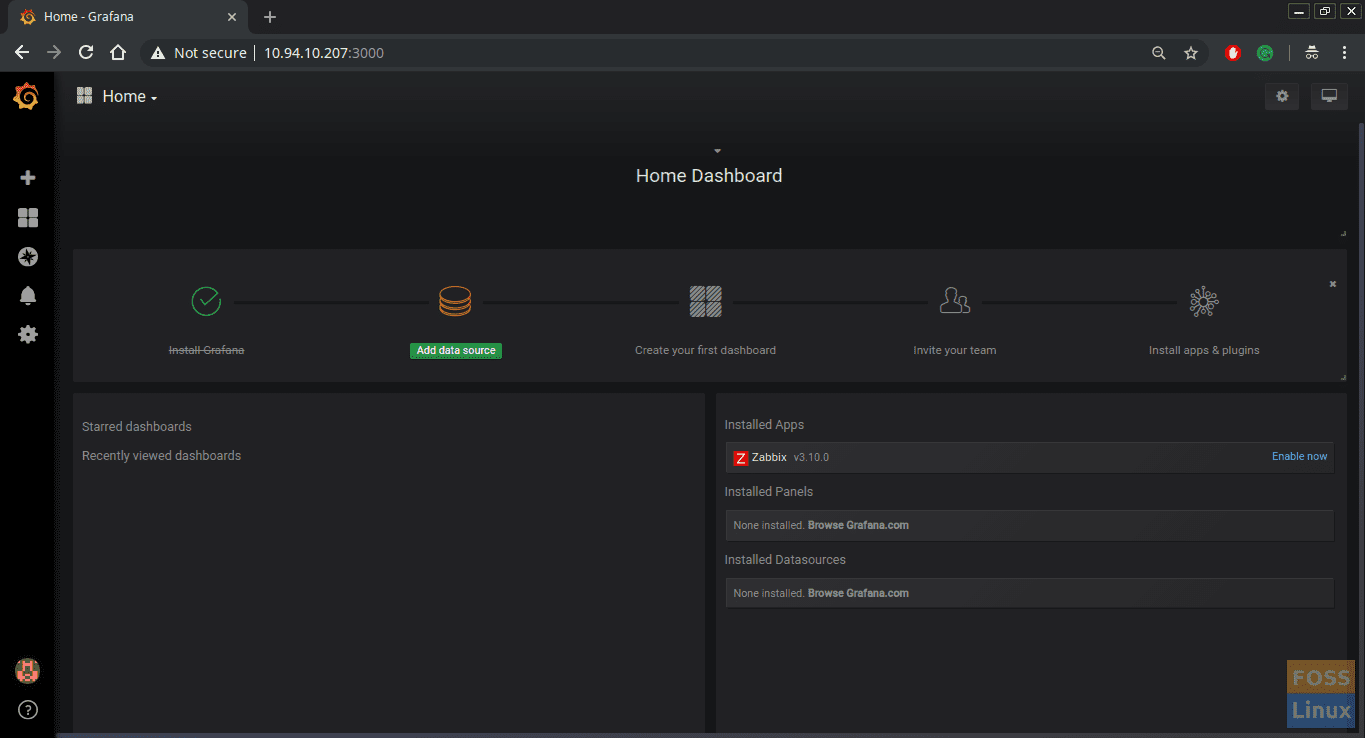
Zabbix Plugin
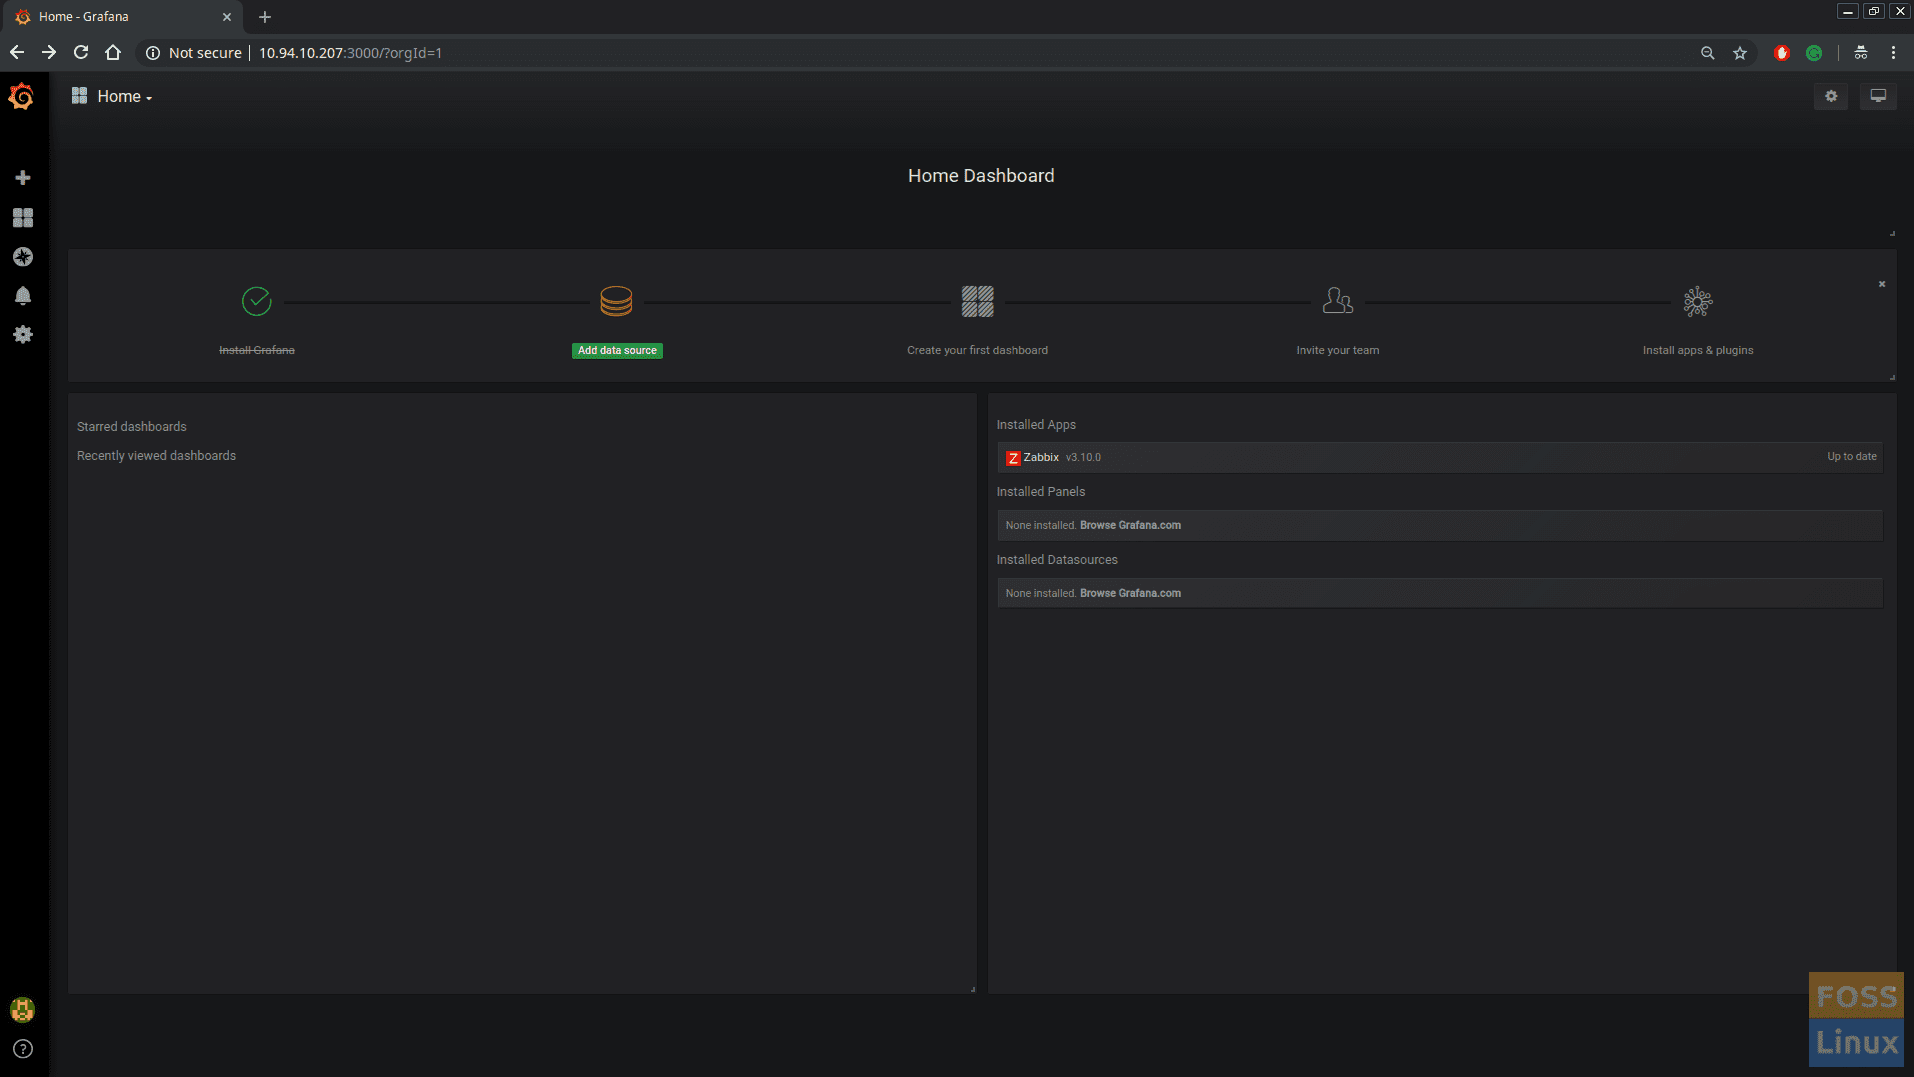
The dashboard should show that the Zabbix plugin is up to date.
Step 9 – Configure Zabbix Plugin
Click on “Add data Source.”
Click Add Data Source from DashBoard
You should see various kind of data sources. Select Zabbix from it.
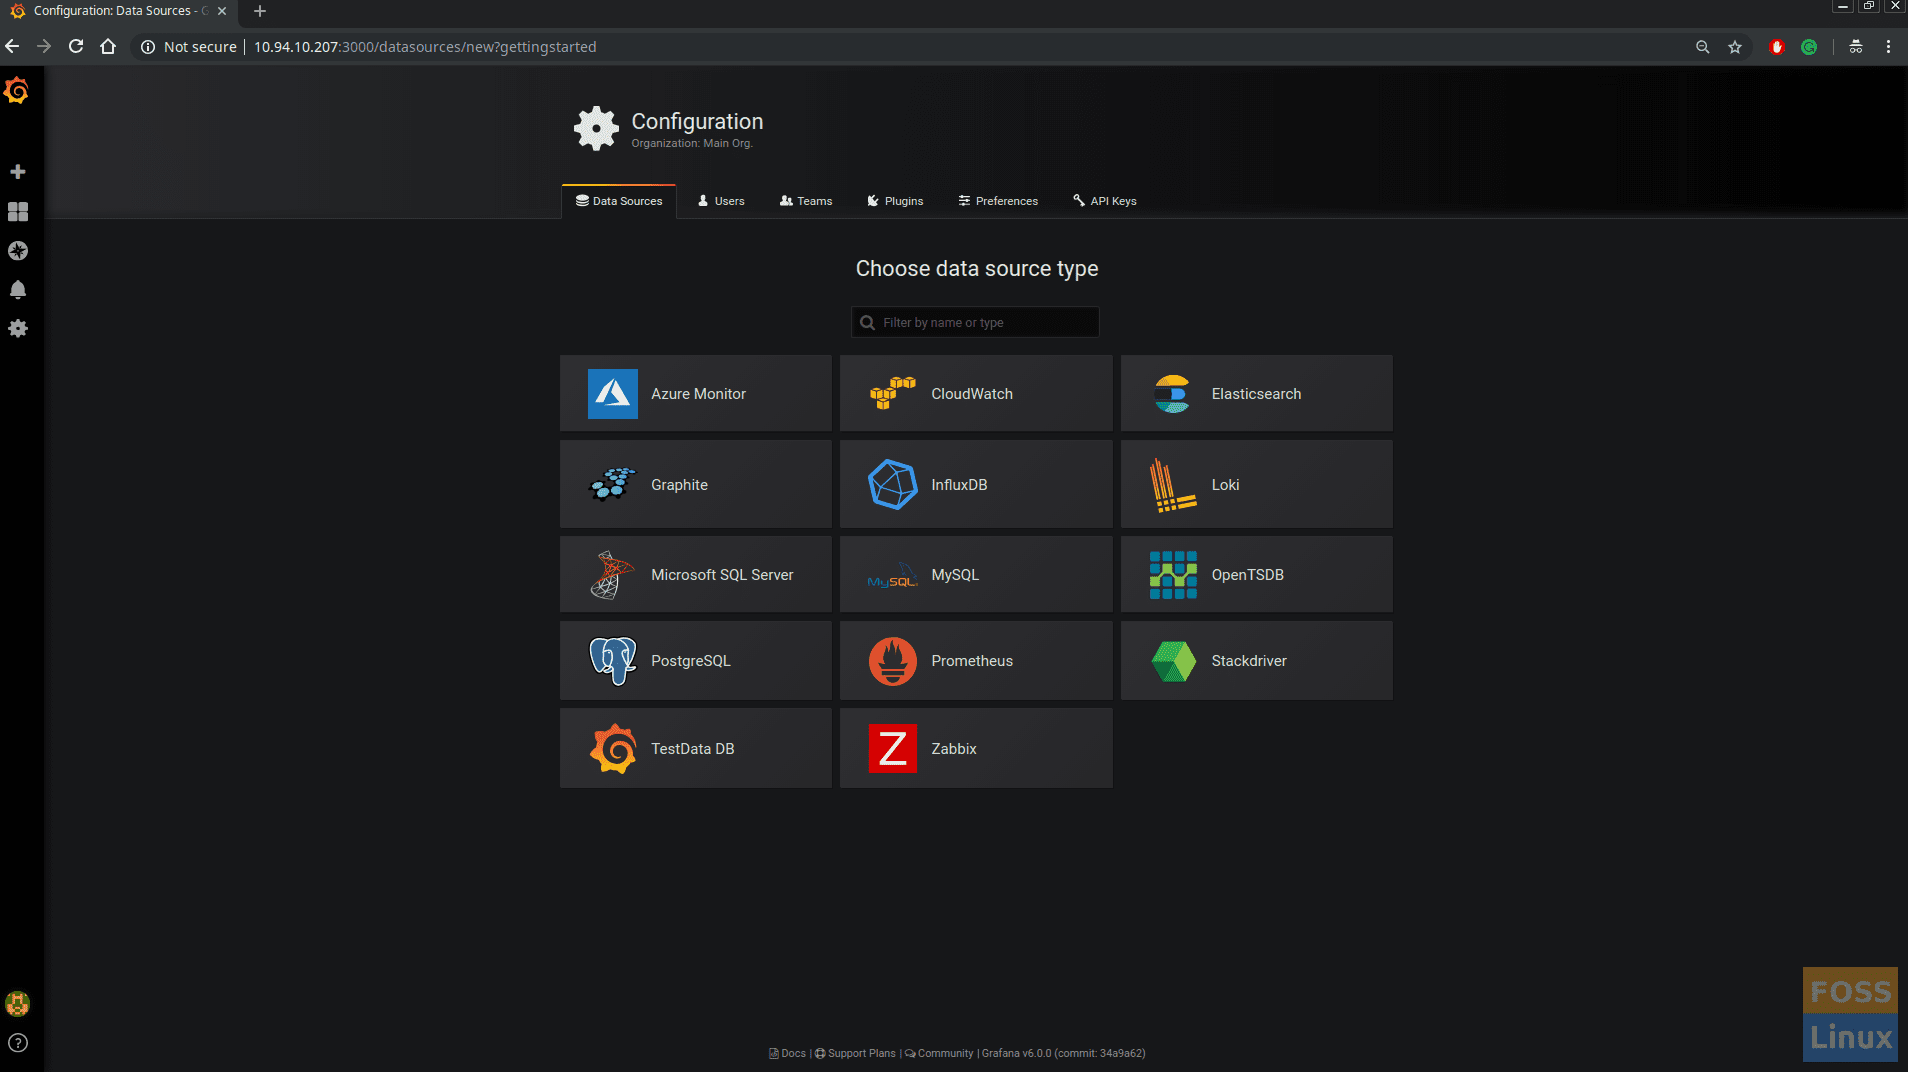
Select Zabbix DataSource
Next, you should see the configuration page.
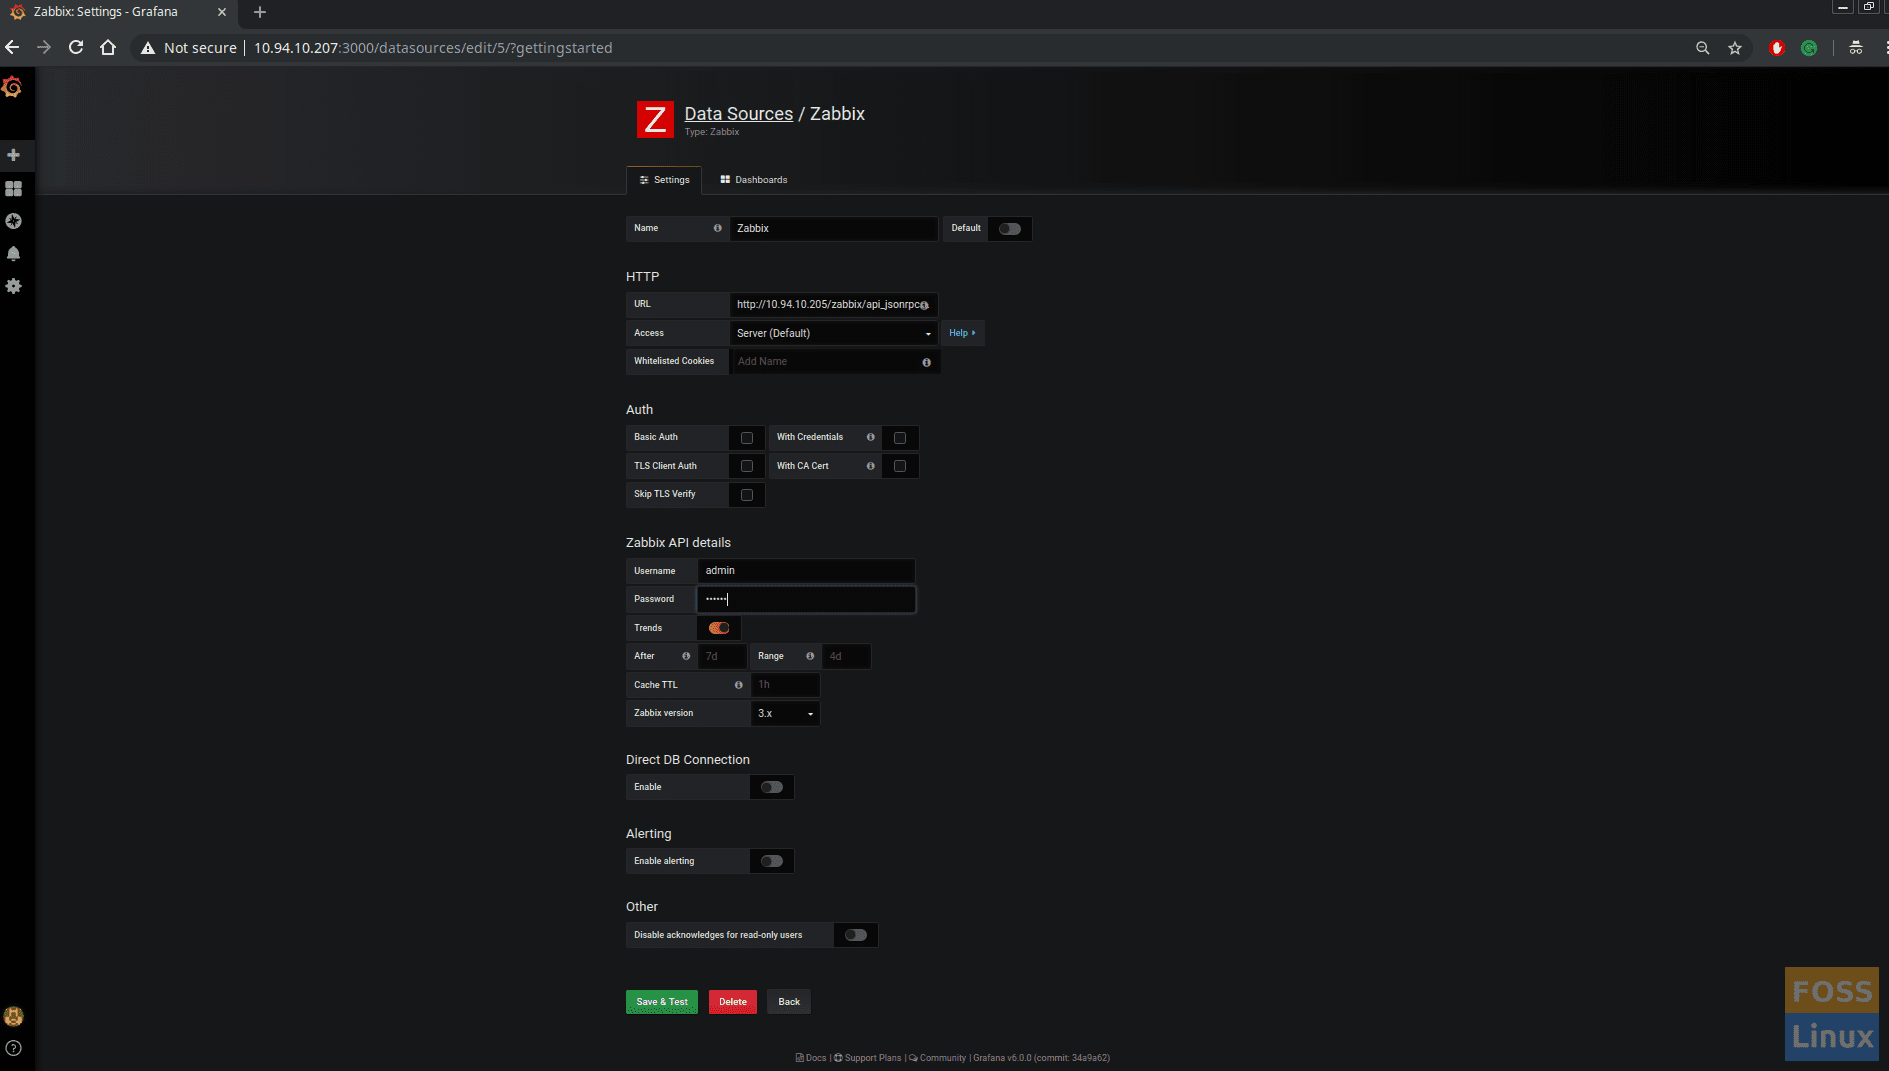
Add Zabbix Server Details
Under HTTP modify URL, add Zabbix Server User Name and Password under Zabbix API details:
http://Your-Zabbix-ServerIP/zabbix/api_jsonrpc.php
Enable Trends. Click Save and Test.
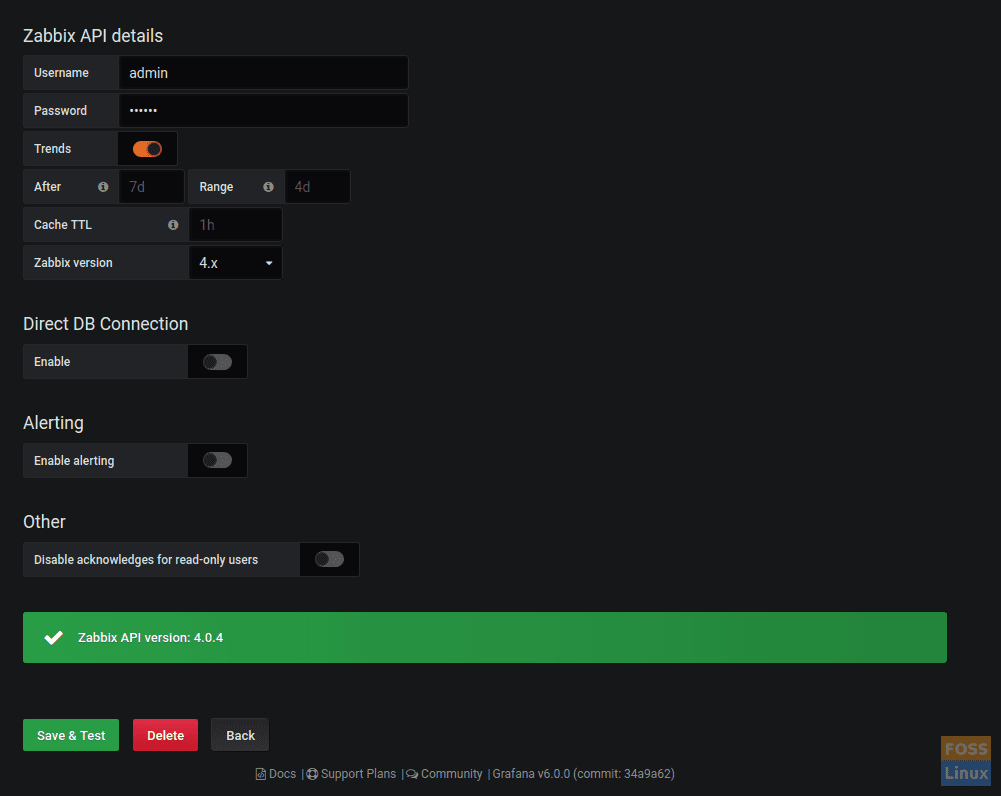
Save and Test DataSource
Go home clicking Dashboards -> Home.
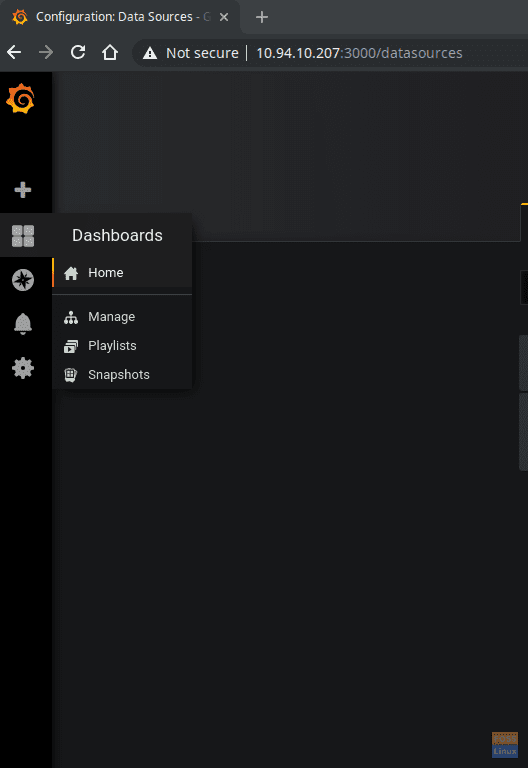
Grafana Home
Step 10 – Create a Dashboard
Click on “New dashboard ” to create.
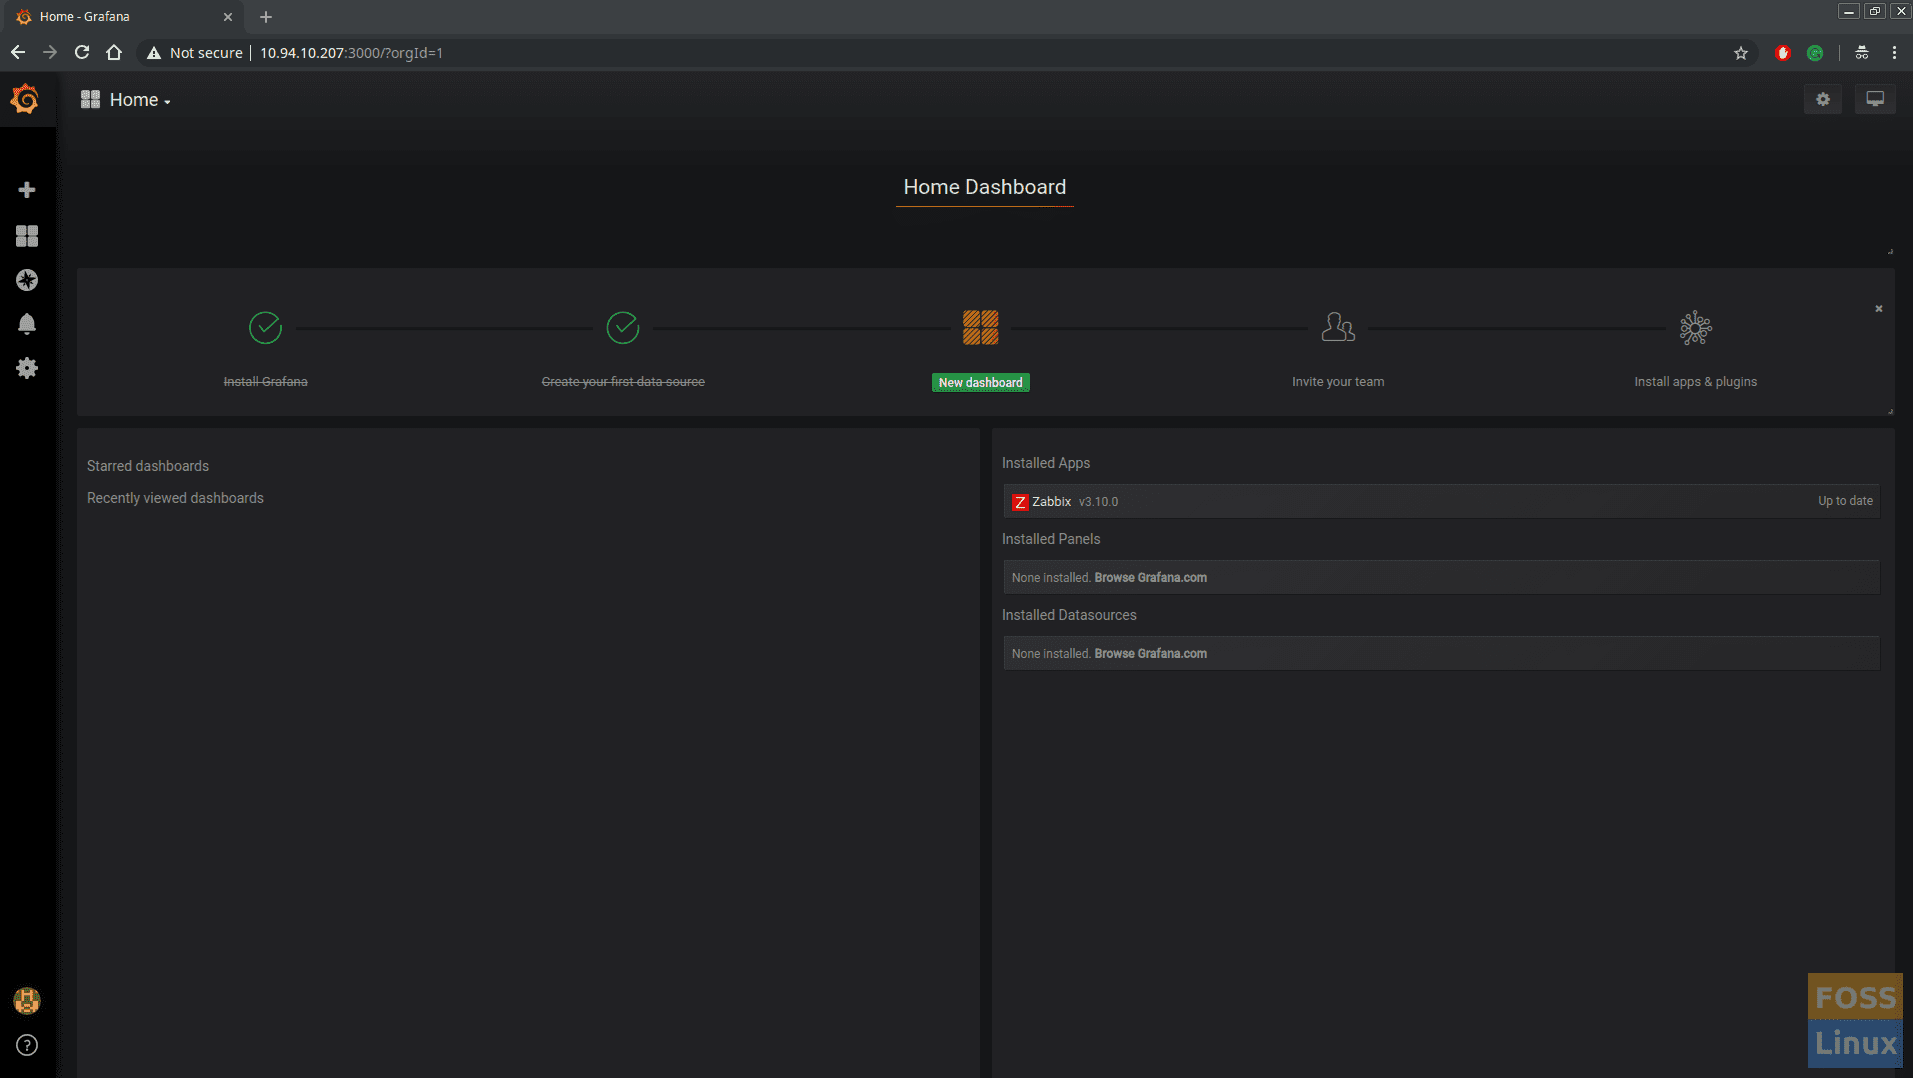
Home-Dashboard
Click on “Add Query”.
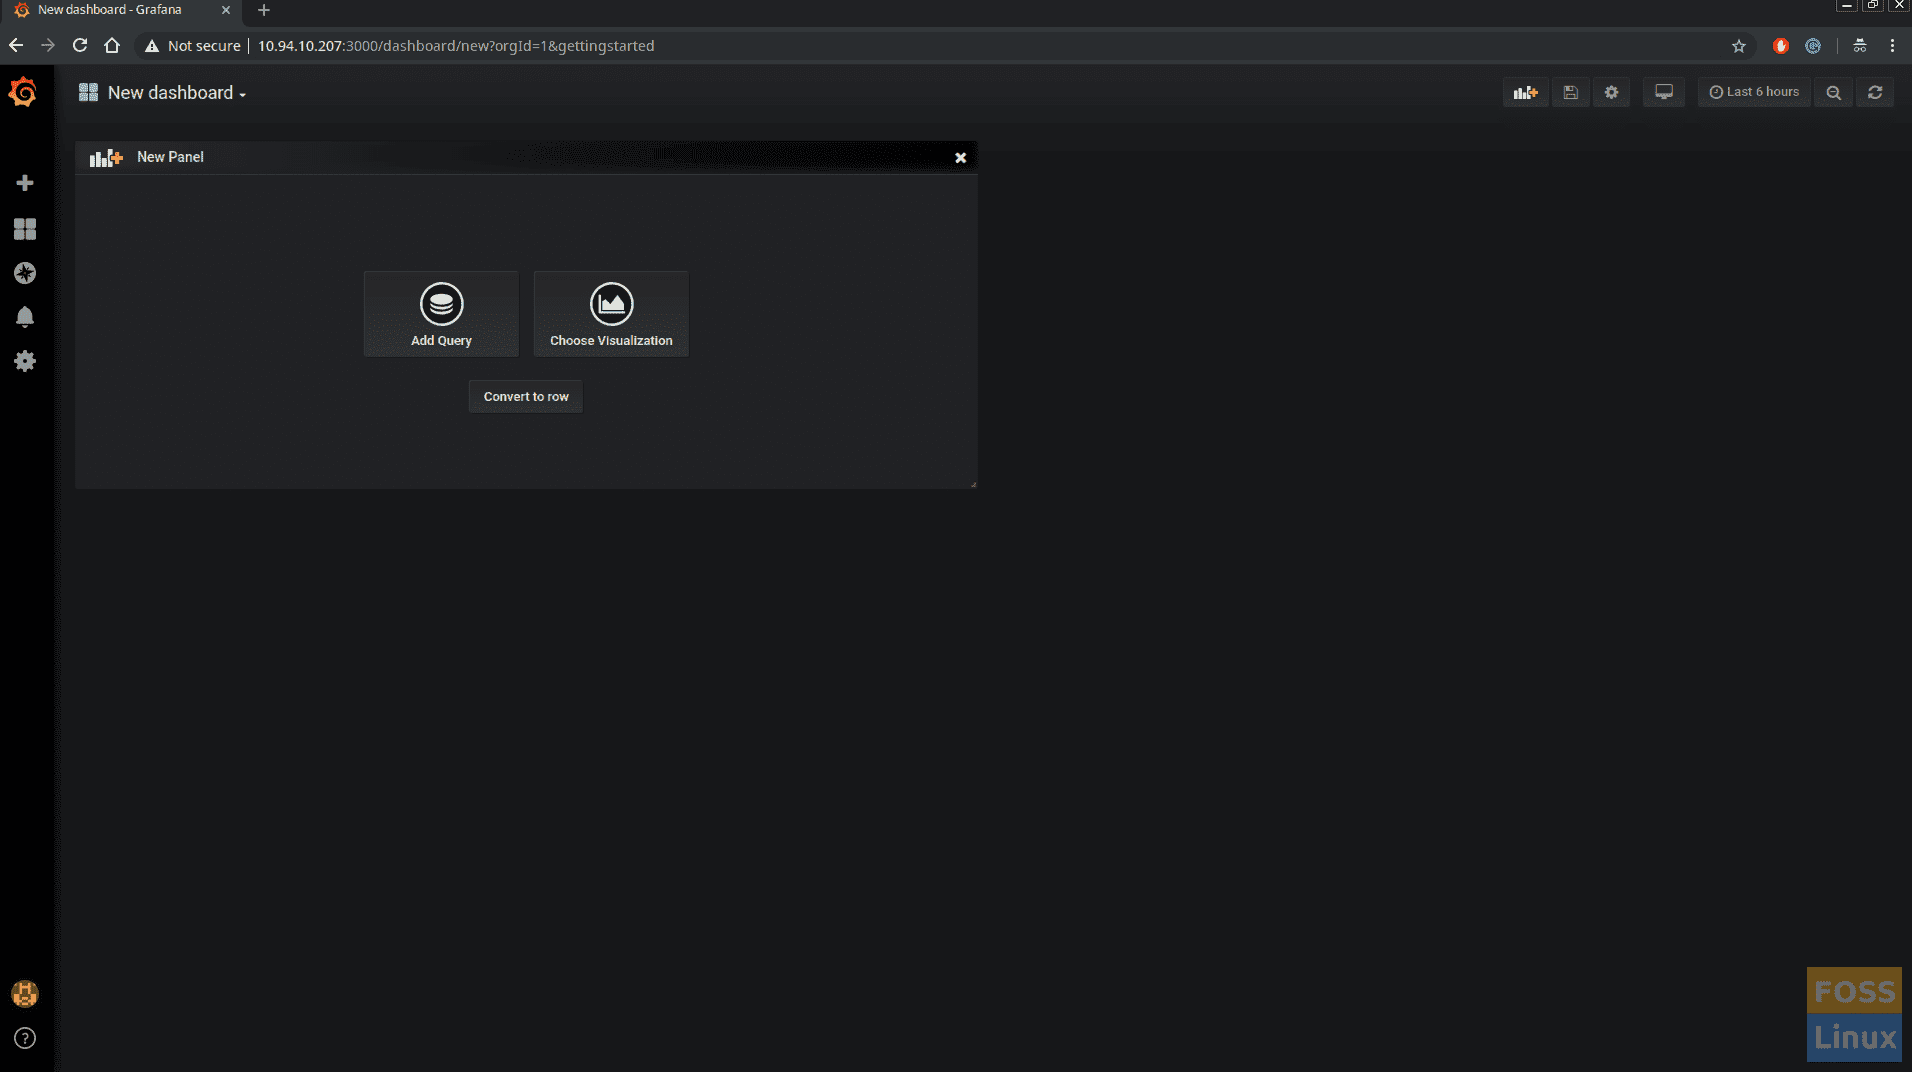
New-Dashboard
You should see the Query window.
Add Query
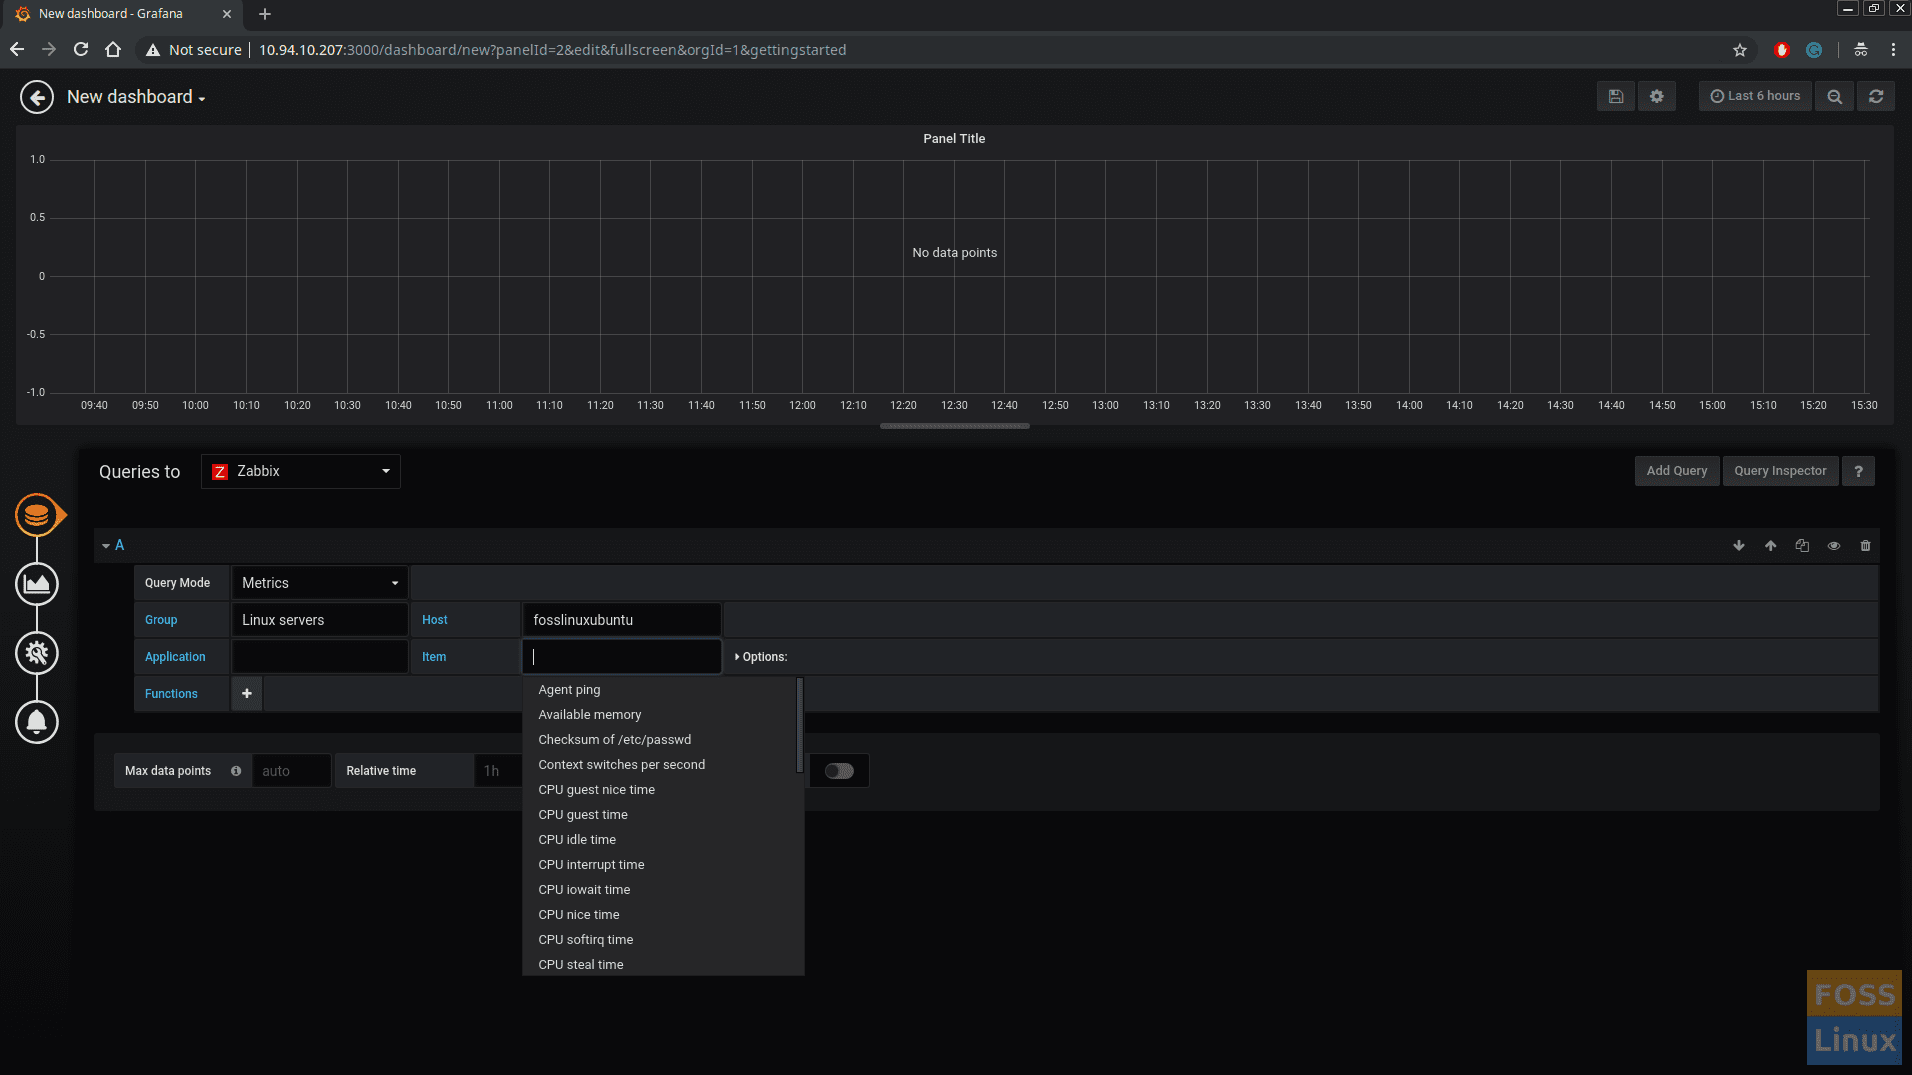
Select Queries to “Zabbix”. Set Query Mode to “Metrics”.
Select “Group”, “Host”, “Application”, “Item” from drop-down menu. (These data comes from Zabbix server).
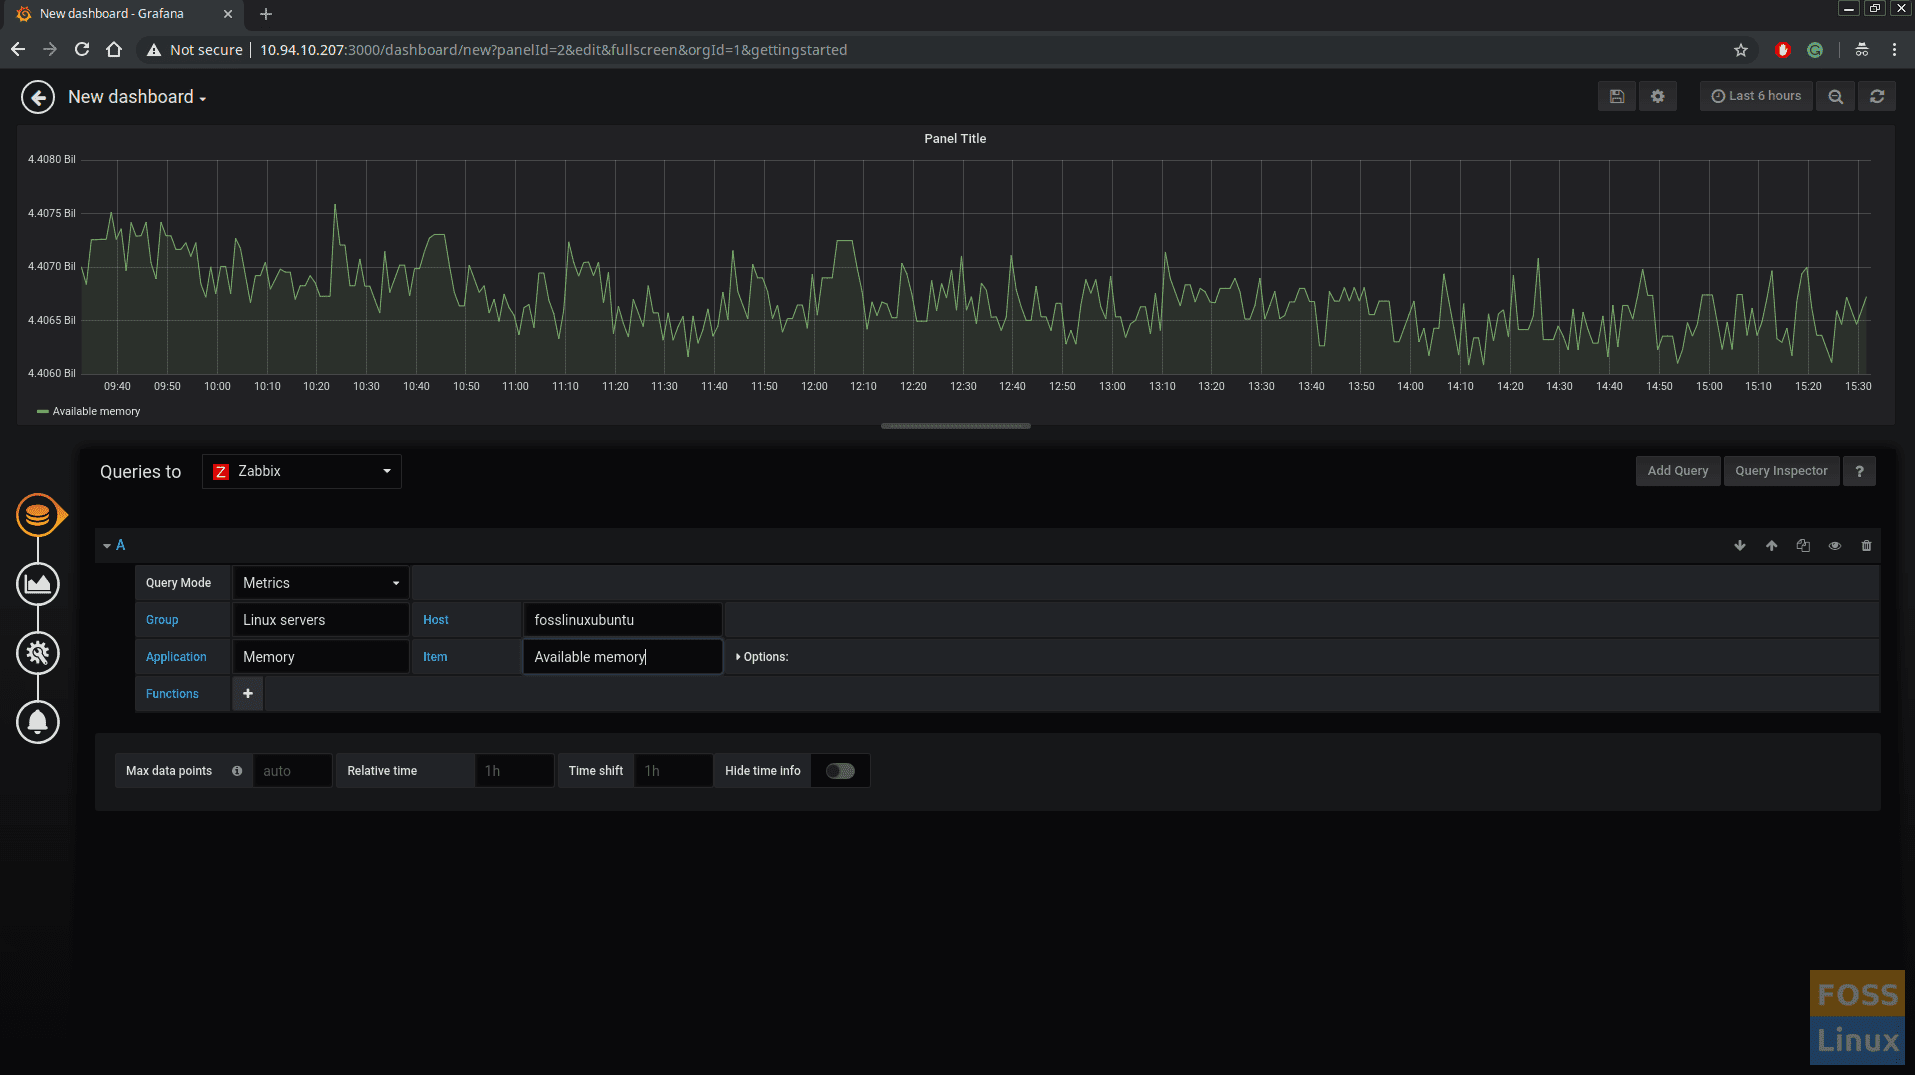
Completed Query Window
Click on Visualization to configure Graph. Select Visualization type from the drop-down menu.
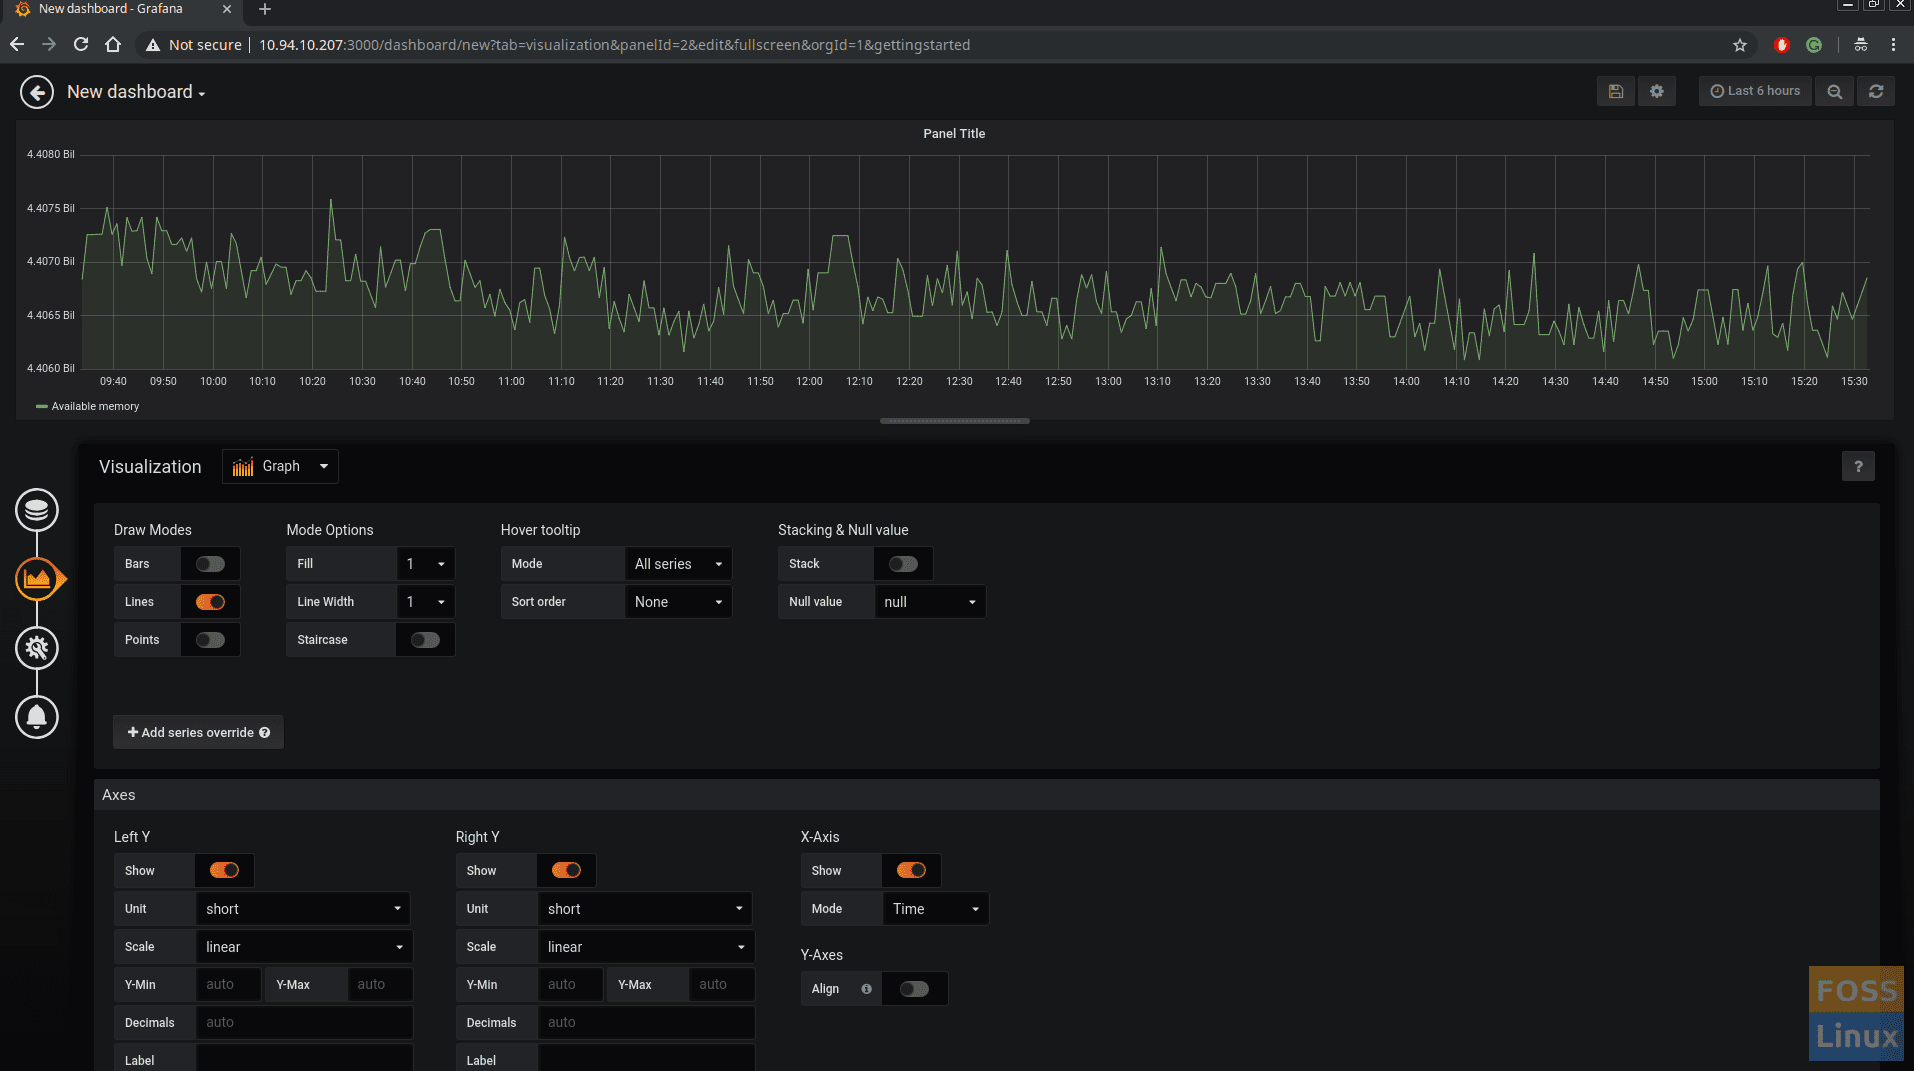
Visualization
Then click general and add a title to the dashboard.
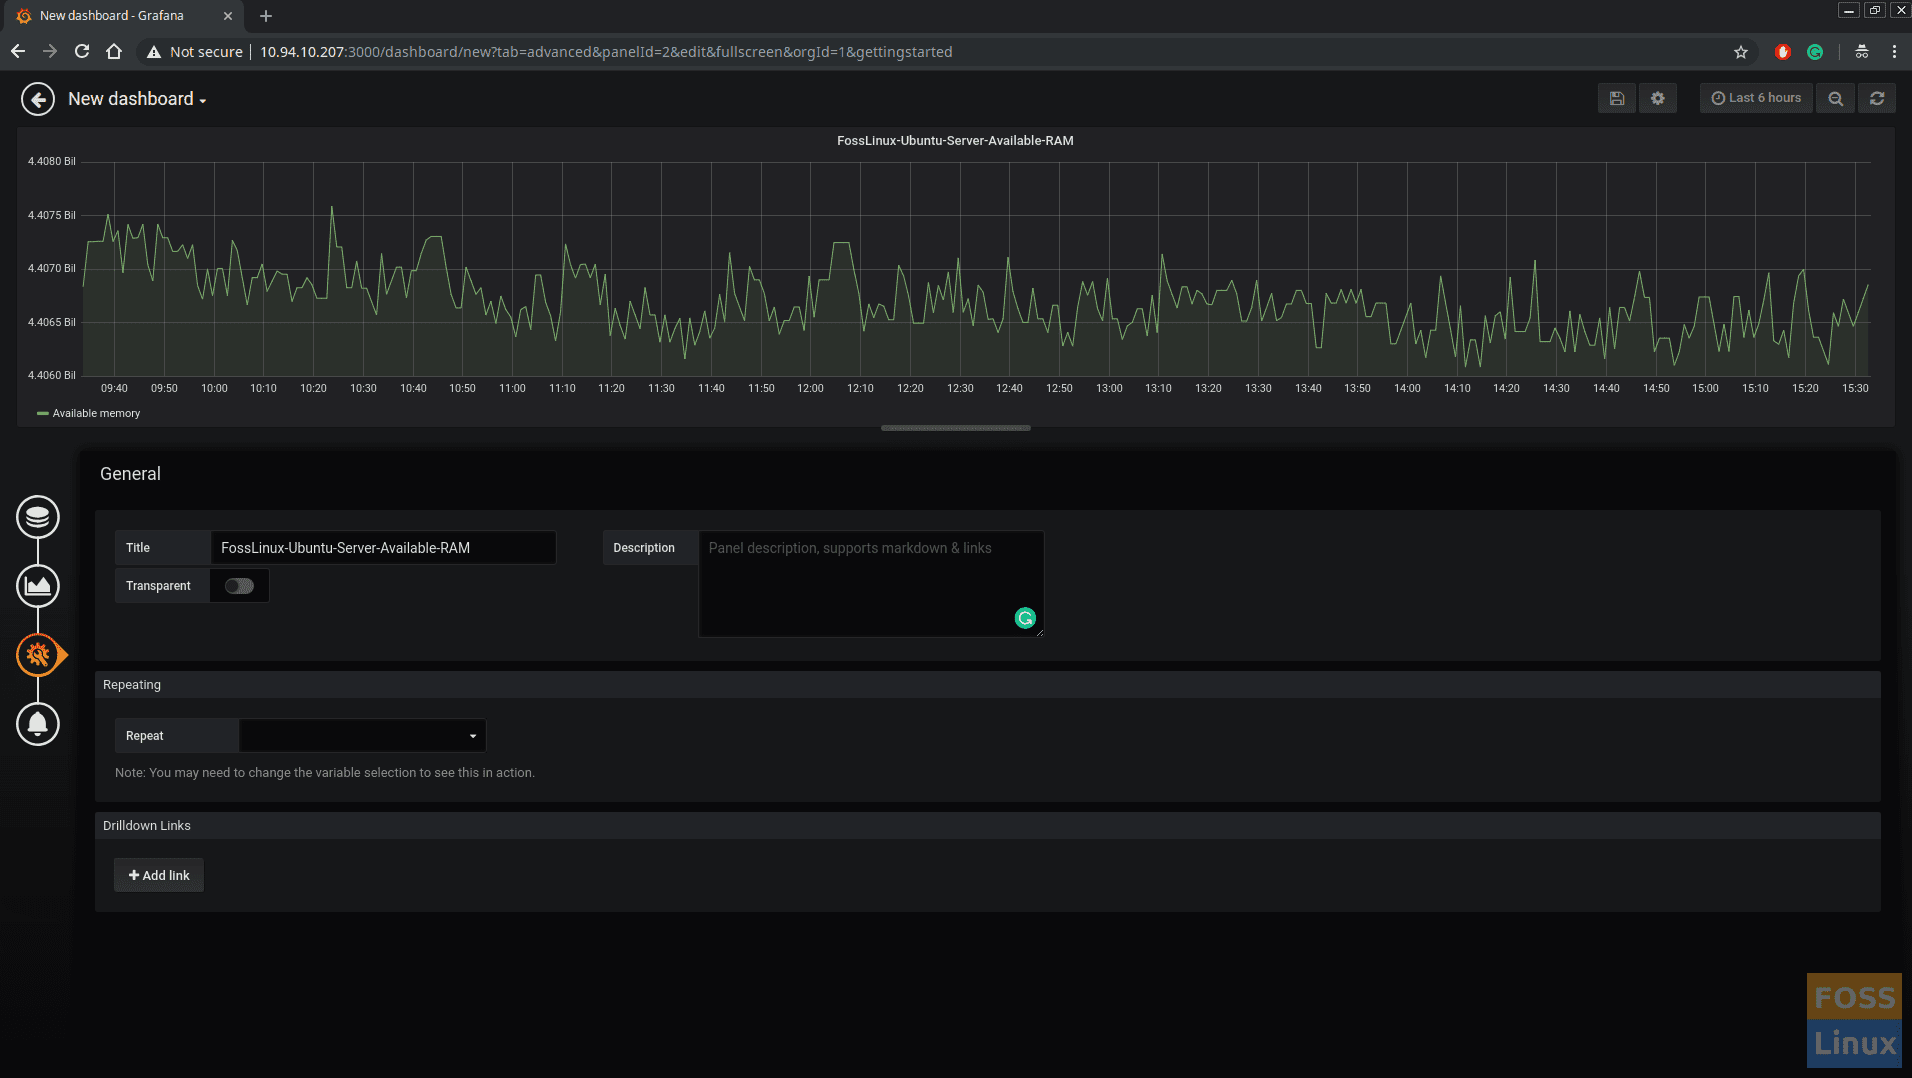
Add Name to Panel
Finally, you can save the Dashboard and give any name.
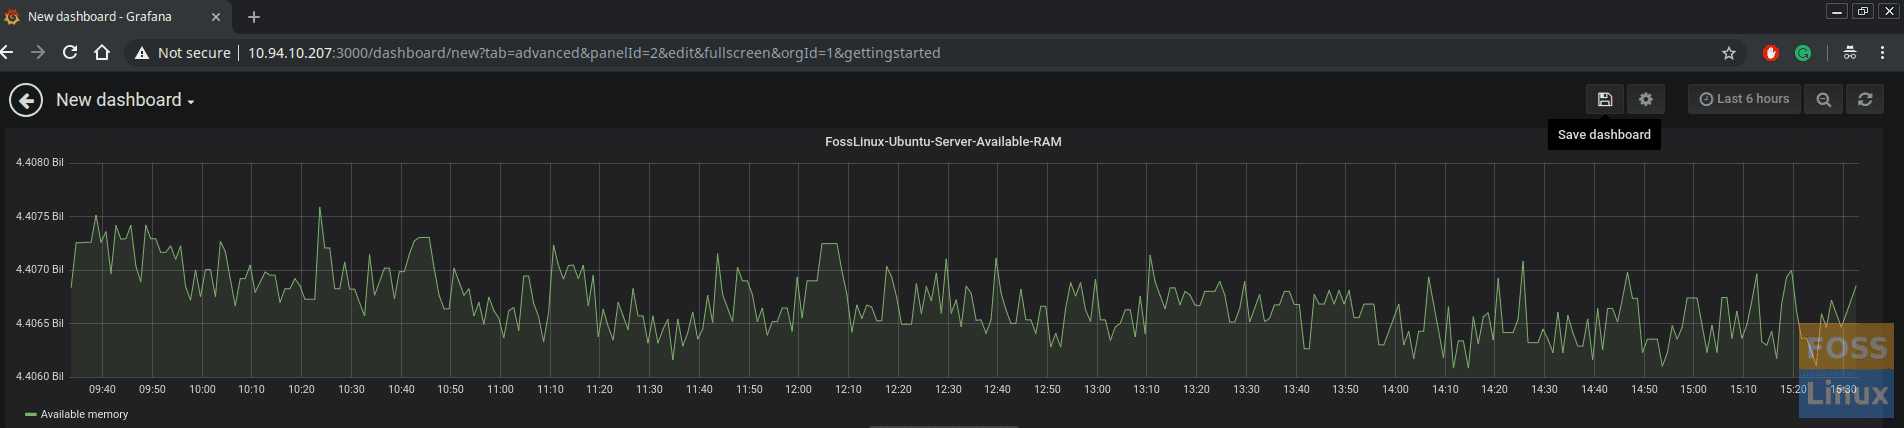
Save Dashboard
You can view your newly created Graph!
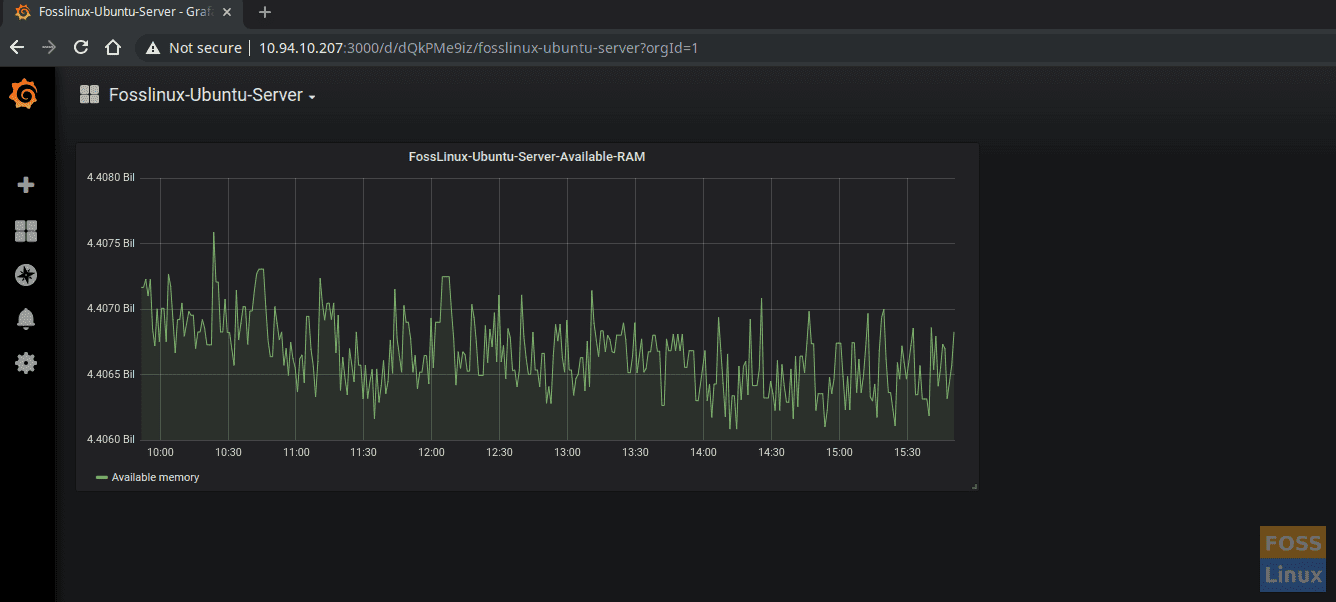
Newly Created Graph
Congratulations, you have successfully installed and configured Grafana with visualization. There are loads of plugins further to explore, and with Grafana able to support various kind of data sources, it’s up to you on how you want to configure those data sources and plugins to suit your needs.
5 comments
Hi Team,
I am facing some issues during installation of grafana.
1.[root@support1441 ~]# yum install urw-fonts
Loaded plugins: product-id, search-disabled-repos, subscription-manager
This system is not registered with an entitlement server. You can use subscription-manager to register.
2.[root@support1441 ~]# firewall-cmd –zone=public –add-port=3000/tcp –permanent
FirewallD is not running
Please suggest how to resolve
Cool . Thank you
Do you know how to make without disabling SELinux?
Any tut that starts off with disable SELinux without enabling again…but to get you started:
semanage port -a -t grafanad_port_t -p tcp 3000
It is very ridiculous to start this tutorial with “Disable SELinux”. So now, in order to be more straightforward, you get rid of all your doors and windows at home because it is more practical to come home?
SELinux is a good security solution not that difficult to work with, especially with tools like sealert:
https://docs.fedoraproject.org/en-US/quick-docs/troubleshooting_selinux/
https://access.redhat.com/articles/2191331