
In this article, we delve into the digital landscape’s intricacies and unravel some of the most potent, open-source, and free monitoring tools available to users around the world. Monitoring tools are software applications that help us keep track of our system’s health, performance, and overall efficiency.
They can be applied across a variety of platforms, from network monitoring and server supervision to website tracking and application performance assessment. Each tool brings something unique to the table, so let’s explore some of my favorites.
15 Best Open Source and Free Monitoring Tools
1. Nagios: A powerful open-source tool for monitoring systems, networks, and infrastructures
Nagios
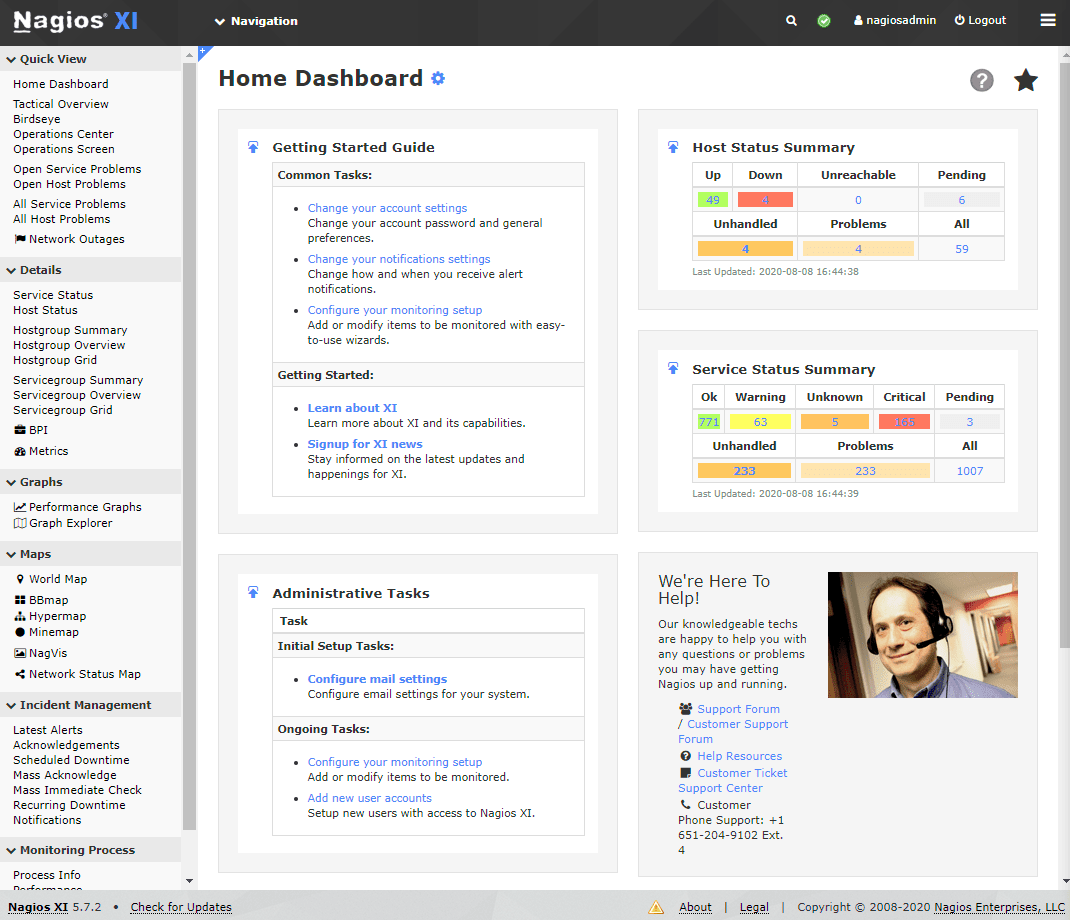
Nagios is the granddaddy of monitoring tools, with its roots dating back to 1999. This powerful, open-source tool provides monitoring for systems, networks, and infrastructures. If you are dealing with a large number of servers, Nagios can be your best friend, giving you complete visibility into your network’s status.
Practical Example: In a practical scenario, let’s say you manage an e-commerce business with a website that experiences heavy traffic. Nagios can continuously monitor your servers to ensure that they remain active and functional, alerting you to any potential issues before they become severe problems. Nagios’ strengths lie in its expansive plugin library and extensive customization.
Pro tip: Familiarize yourself with the Nagios plugin library, which can expand the tool’s functionality significantly. However, keep in mind that Nagios has a somewhat steep learning curve, which could be a disadvantage for beginners.
2. Zabbix: A popular open-source monitoring solution for networks, servers, applications, and more
Zabbix Overview
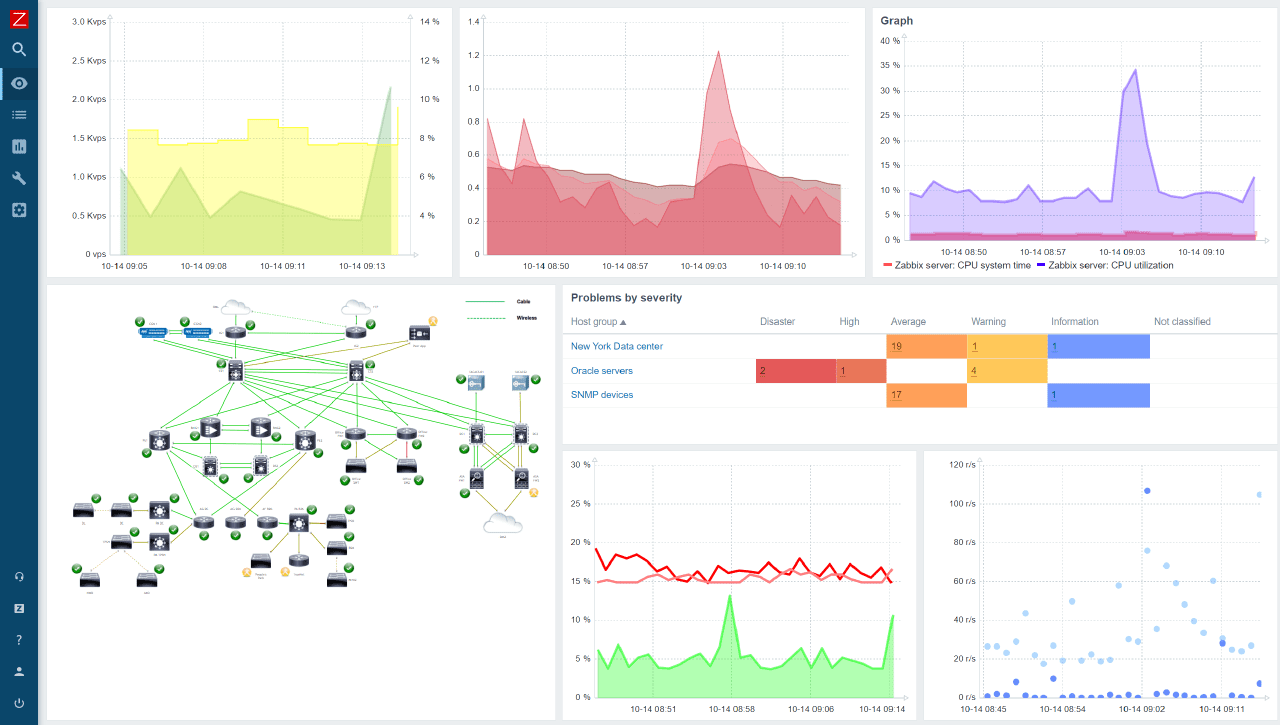
Zabbix is another popular open-source monitoring solution that can monitor networks, servers, applications, and much more. The tool is known for its robustness, extensive features, and scalability, making it suitable for businesses of any size.
Practical Example: Let’s say your business operates in various locations worldwide. Zabbix can efficiently manage your complex network, giving you granular control and detailed insight into your entire infrastructure’s performance. Although I personally find its user interface a bit clunky and outdated, Zabbix is an undeniably powerful tool that can handle anything you throw at it.
Pro tip: Utilize Zabbix’s strong template functionality to streamline your monitoring setup.
3. Prometheus: An open-source monitoring system for microservices and containers
Prometheus Architecture
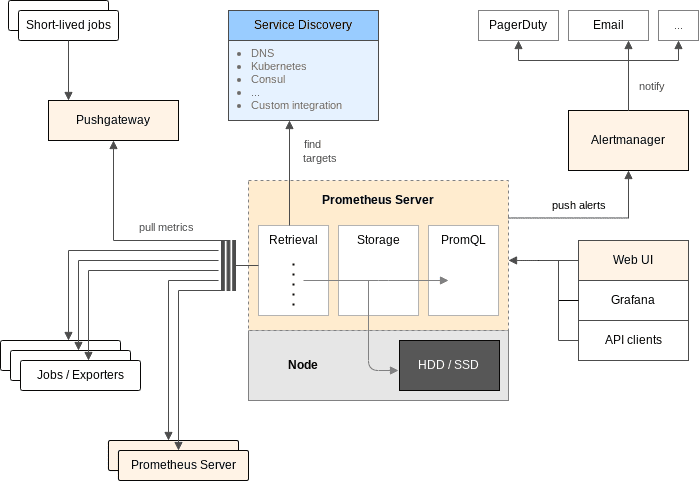
Prometheus is an open-source monitoring system and time-series database specifically designed for monitoring microservices and containers at scale. It’s especially well-suited for collecting metrics and providing alerts in Kubernetes environments, making it a favorite for cloud-native companies.
Practical Example: If you are running a complex, containerized application across multiple environments, Prometheus can offer valuable insights into each microservice’s performance. However, it can be challenging to set up for larger infrastructures, which is a personal gripe of mine.
Pro tip: If you’re using Prometheus, integrate it with Grafana for better visualization of metrics.
4. Grafana: A multi-platform open-source analytics and visualization platform
Grafana
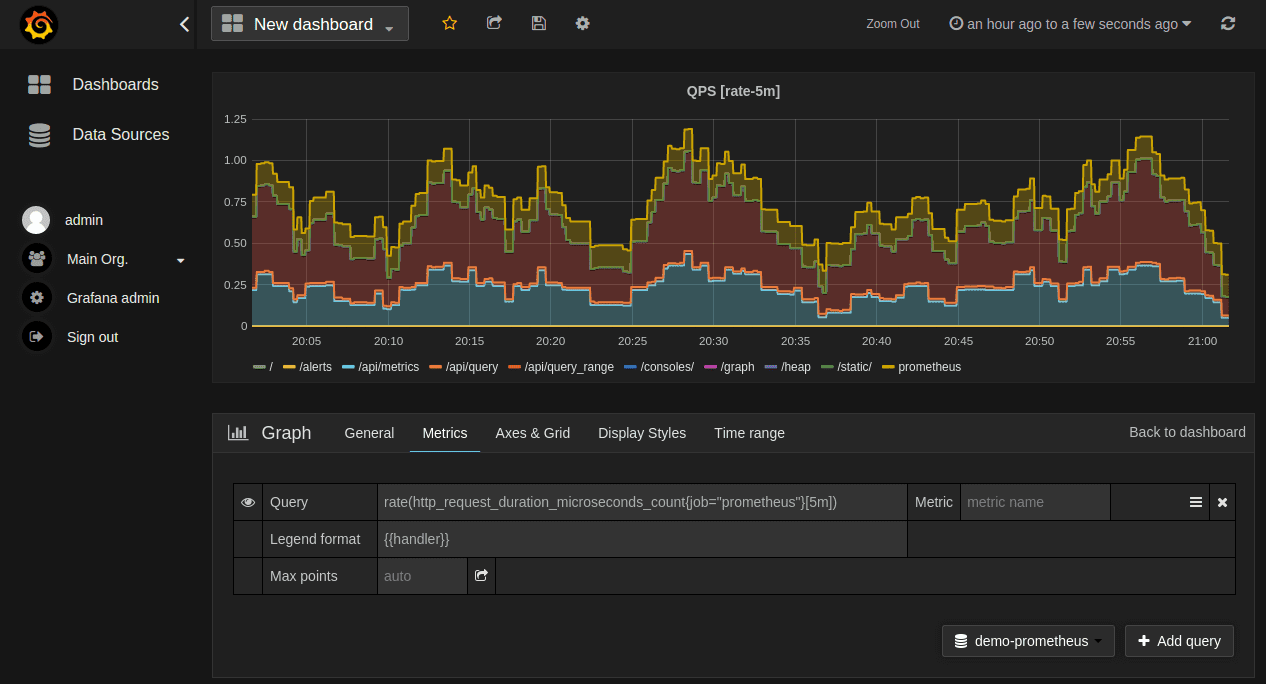
Speaking of Grafana, it is a multi-platform, open-source analytics and visualization platform that is often used in conjunction with other monitoring tools like Prometheus. It allows you to create beautiful, meaningful, and insightful dashboards from your data.
Practical Example: Suppose you’re analyzing the response times of your application servers. Grafana can take this data and turn it into a visual graph, making it easier for you to spot trends and patterns. It’s one of my favorite visualization tools, despite being a little complex to understand initially.
Pro tip: Grafana has a wealth of plugins available to enhance your data visualization, so take time to explore them.
5. Netdata: A real-time open-source tool for monitoring system and application performance
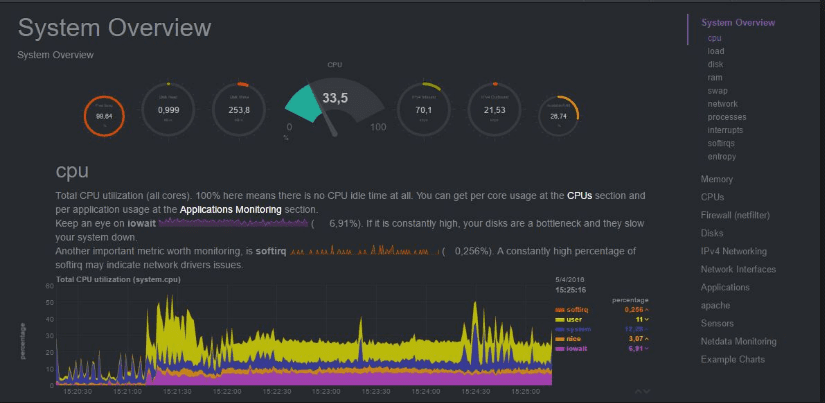
Netdata Dashboard
Netdata is an open-source monitoring tool designed for real-time performance and health monitoring of systems and applications. It’s lightweight, runs on various systems without disrupting their function, and its web interface is easy to understand.
Practical Example: Suppose you have a local server that handles your data. Netdata can provide insights into that server’s disk I/O, CPU usage, RAM usage, and network bandwidth, all in real time. My only issue with Netdata is that it’s not as robust for larger infrastructures.
Pro tip: Make full use of Netdata’s real-time capabilities to catch issues as soon as they occur.
6. ELK Stack: A combination of tools for real-time insights from structured or unstructured data sources
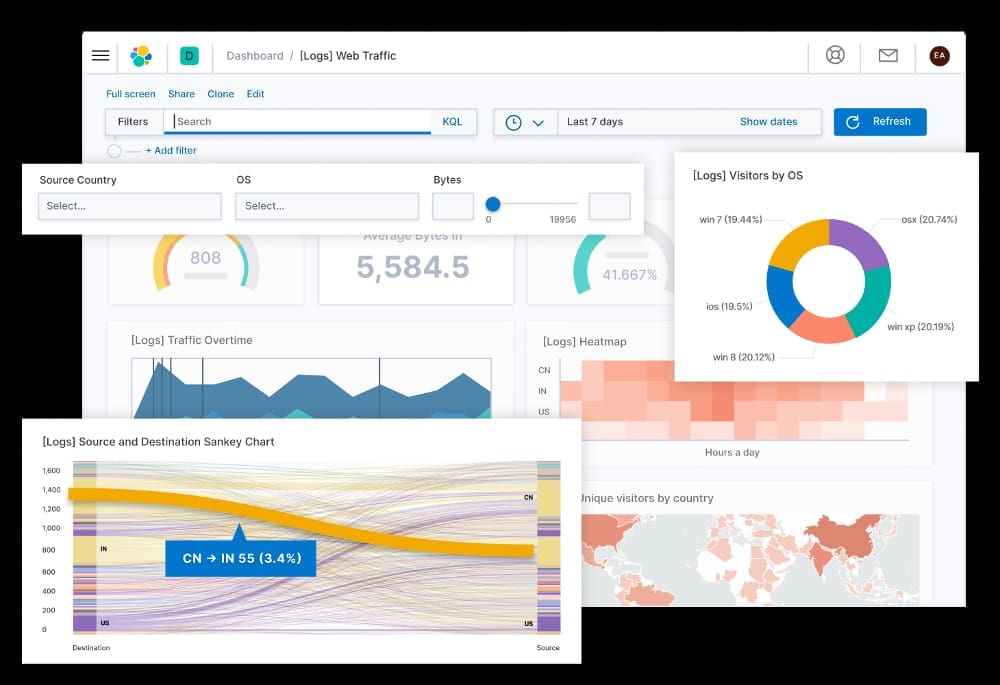
ELK Stack
The ELK Stack combines three open-source tools—Elasticsearch, Logstash, and Kibana—to provide actionable insights in real-time from almost any type of structured or unstructured data source. It’s widely used for log and event data analysis.
Practical Example: For instance, if you’re running multiple microservices, the ELK Stack can gather logs from each service, analyze the data, and present it in an easily digestible form. The drawback, in my experience, is that the stack can be resource-intensive, which might pose challenges for smaller operations.
Pro tip: Regularly tune your ELK Stack configuration to avoid overusing resources.
I’ll pause here to say that I am a big fan of open-source monitoring tools, and while I am sharing my experience with each, your mileage may vary. The important thing is to find a tool that suits your specific needs and grow into it.
7. Icinga 2: An open-source network monitoring system for large, complex environments
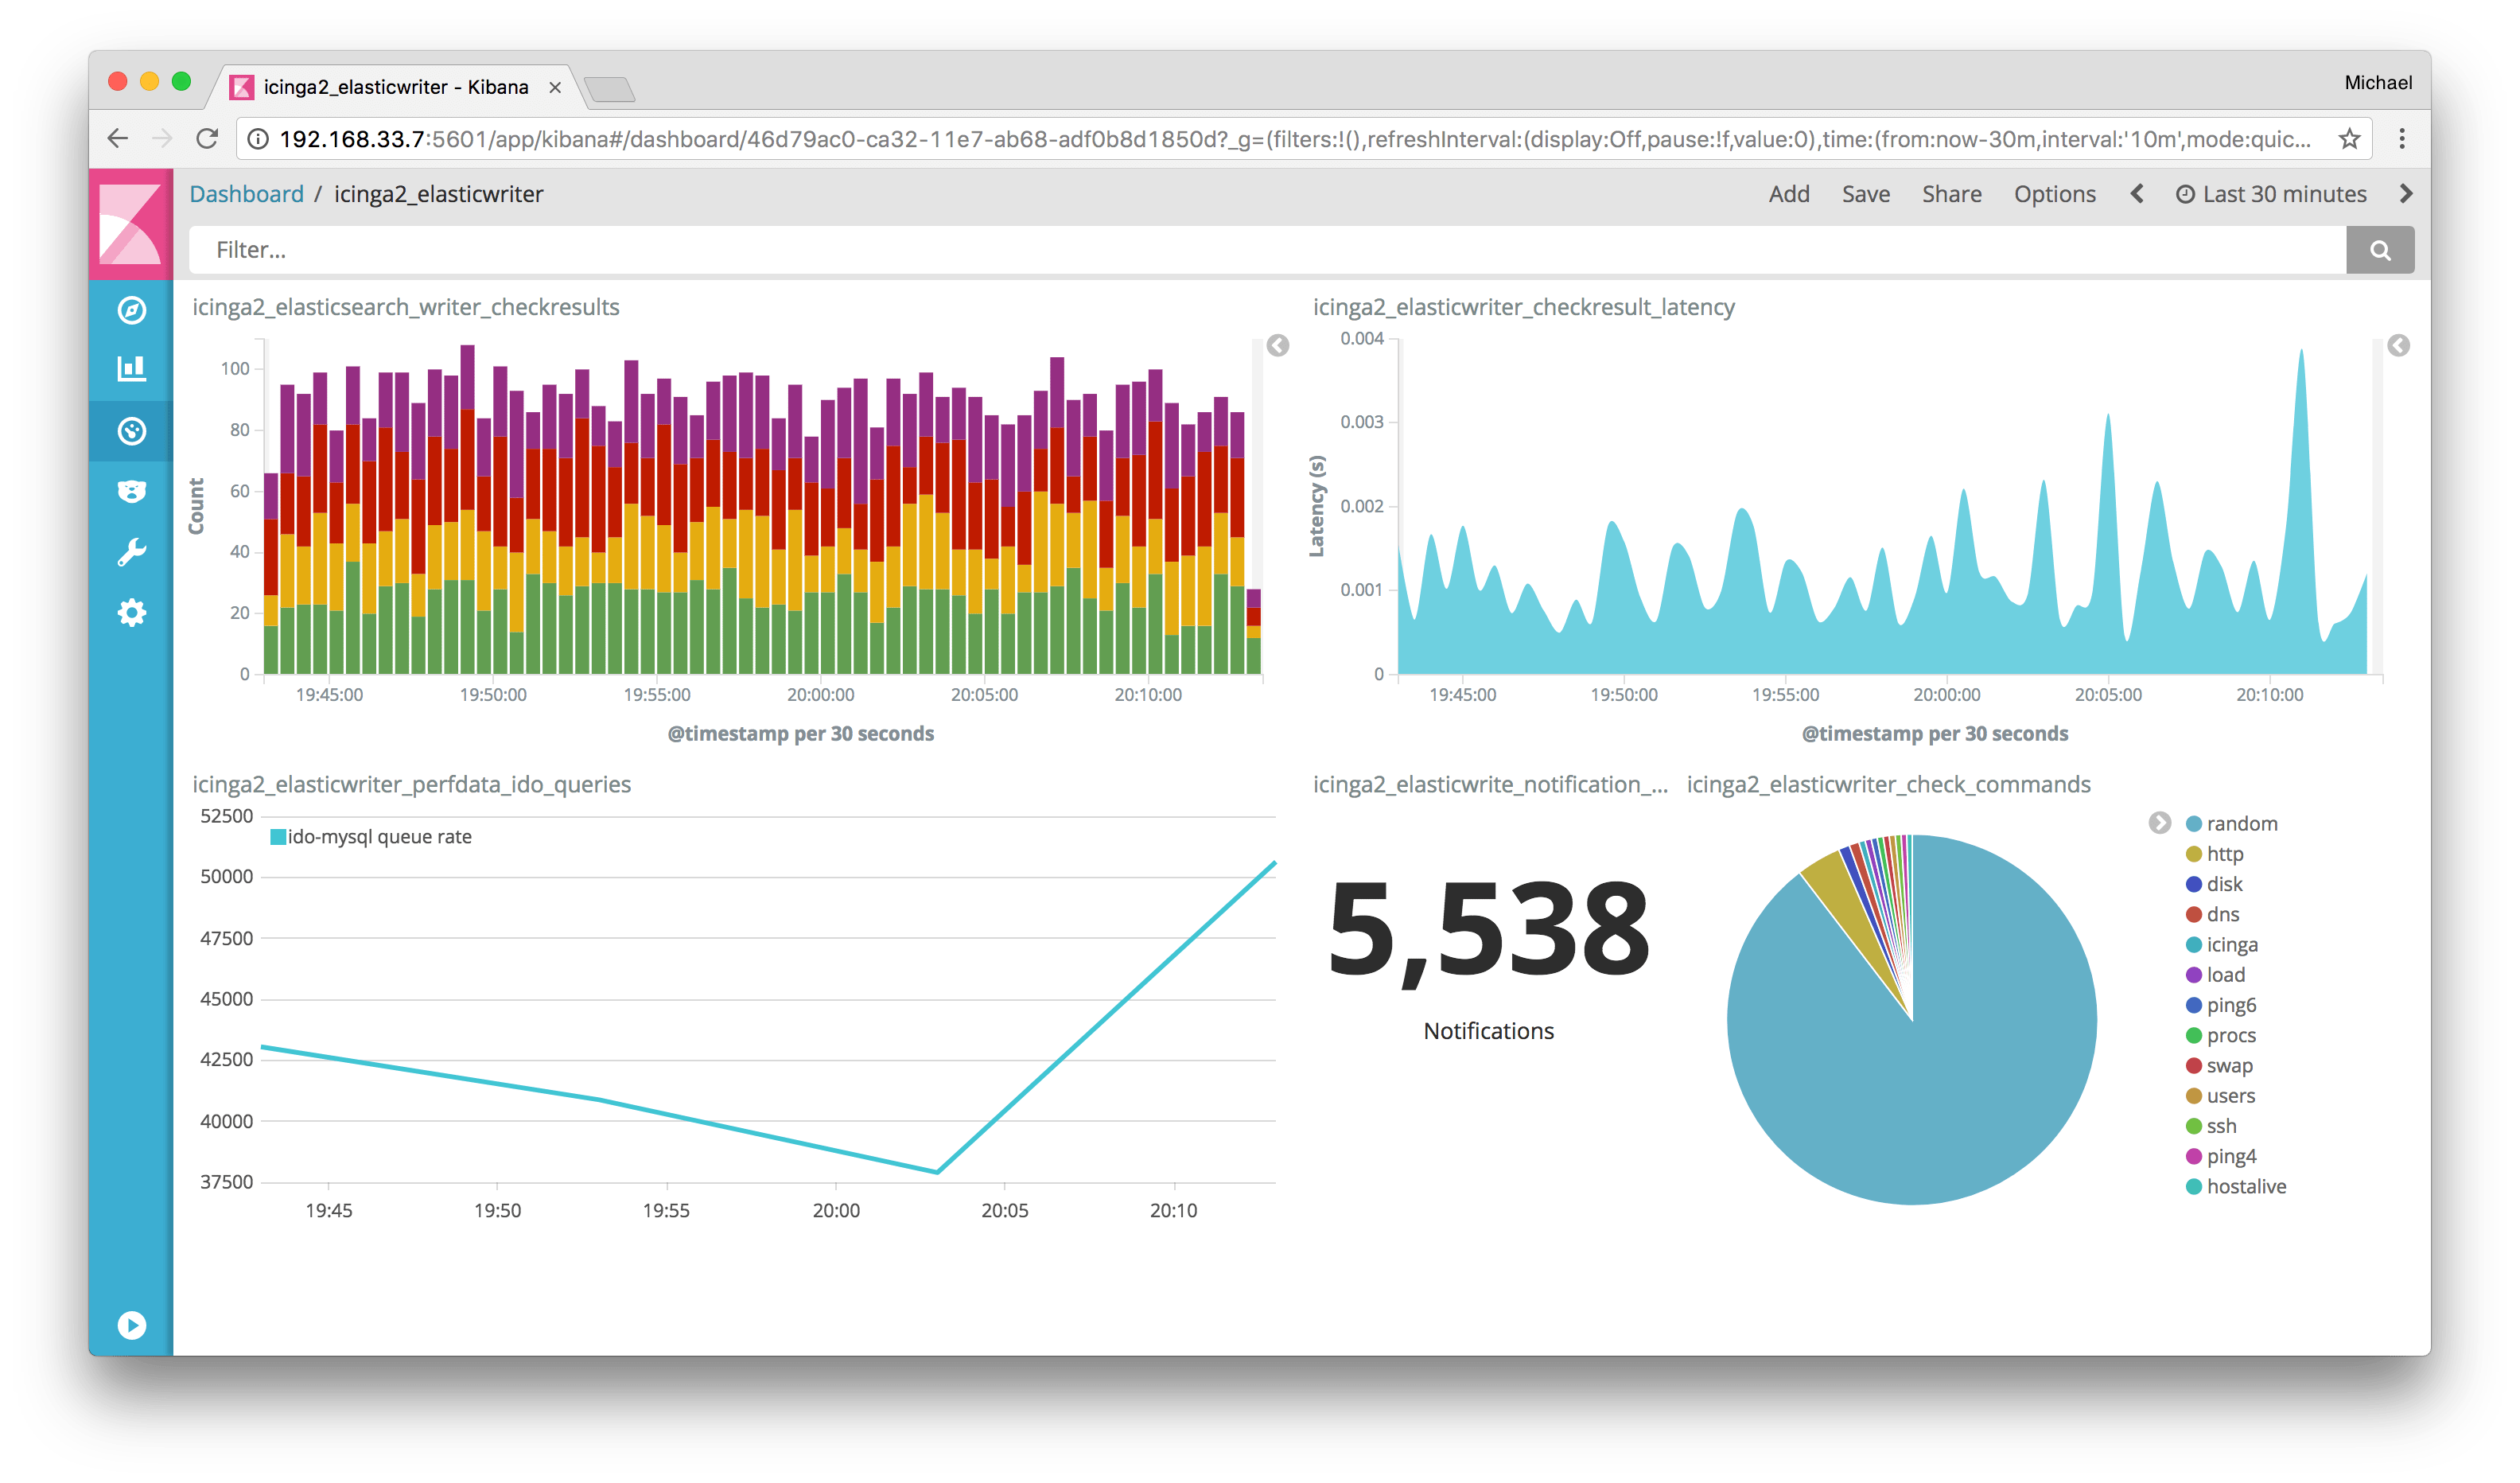
Icinga 2
Icinga 2 is an open-source network monitoring system which checks the availability of your network resources, notifies users of outages, and generates performance data for reporting. It’s scalable and extensible and works exceptionally well on large, complex environments.
Practical Example: Consider a scenario where you’re managing a vast network of IoT devices. Icinga 2 can help you keep track of every single device, ensuring they are online and functioning correctly. My main problem with Icinga is that its setup can be a bit complicated, especially for first-time users.
Pro tip: Use the Icinga Web 2 interface for a more streamlined user experience.
8. Cacti: A web-based network monitoring tool using RRDTool for network statistics
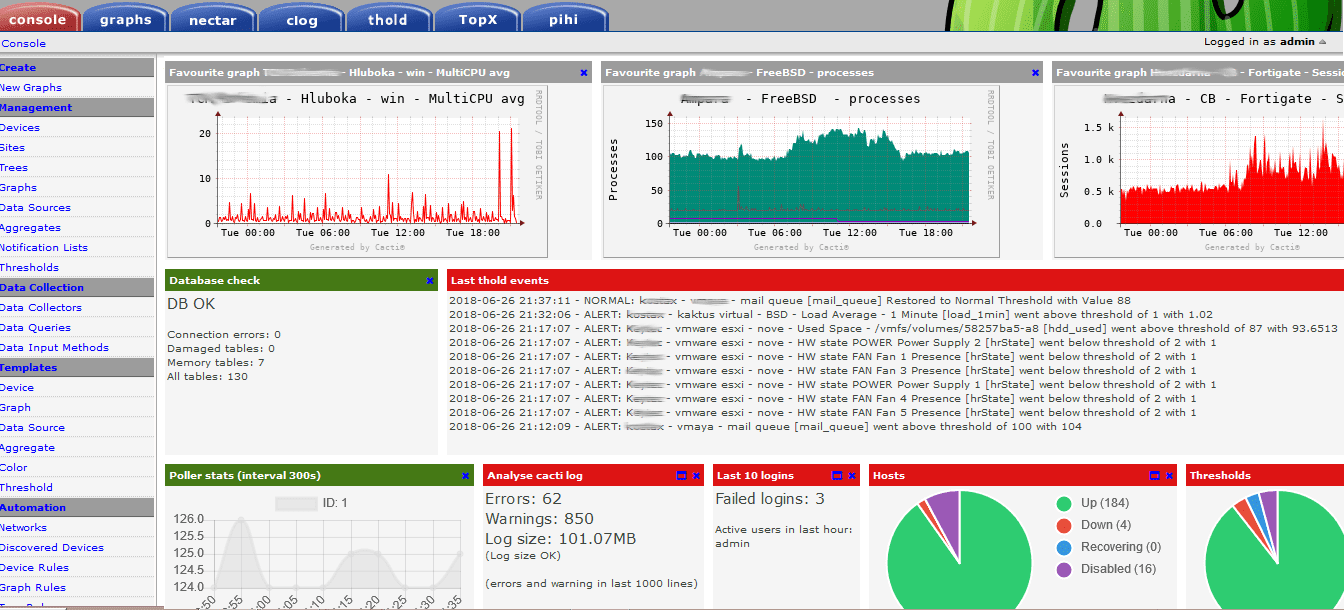
Cacti Dashboard
Cacti is a web-based network monitoring tool that uses RRDTool to store and display network statistics. It provides a fast poller, advanced graph templating, and multiple data acquisition methods.
Practical Example: If you manage a network with various device types, Cacti’s SNMP support can pull metrics from each device and display this information in easy-to-read graphs. Although Cacti is highly useful, its user interface isn’t the most intuitive, which can be off-putting.
Pro tip: Take the time to learn Cacti’s templating system – it’s a powerful tool once you get the hang of it.
9. OpenNMS: An open-source network management application for event and notification management
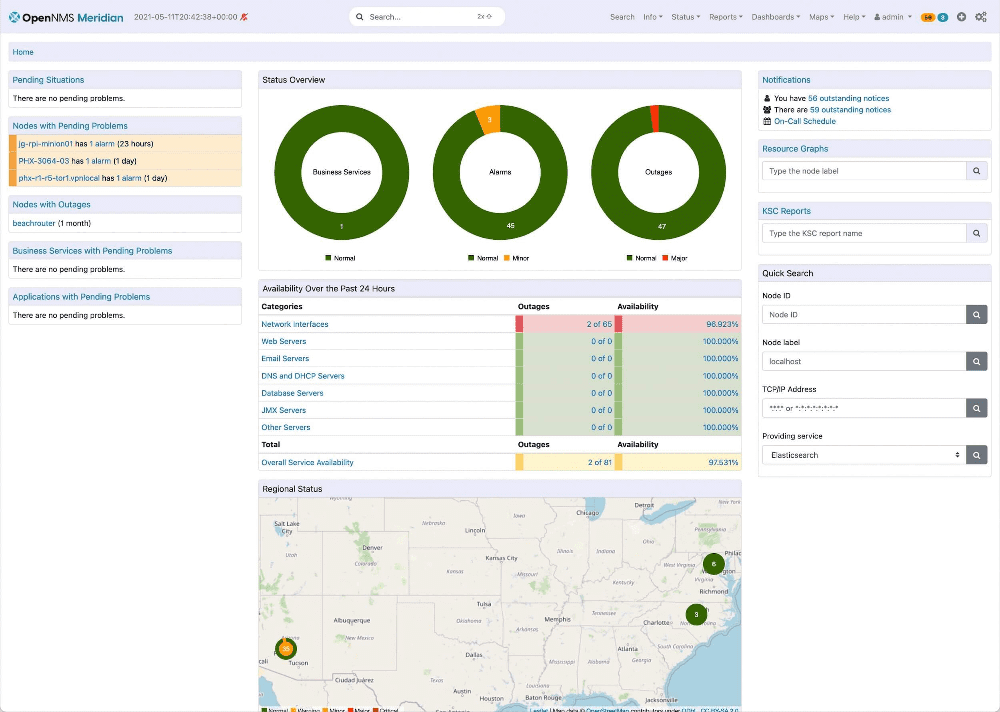
OpenNMS
OpenNMS is an open-source network management application that provides automated discovery, event and notification management, performance measurement, and service assurance features.
Practical Example: For instance, if you are a telecom operator, OpenNMS can monitor your core network devices and alert you to issues such as a high latency link or a failing device. One thing I don’t love about OpenNMS is that its configuration can be a bit arcane, requiring changes to XML files.
Pro tip: Use the Helm plugin to visualize data stored in OpenNMS from Grafana.
10. Collectd: A daemon for collecting, storing, and managing system and application performance metrics
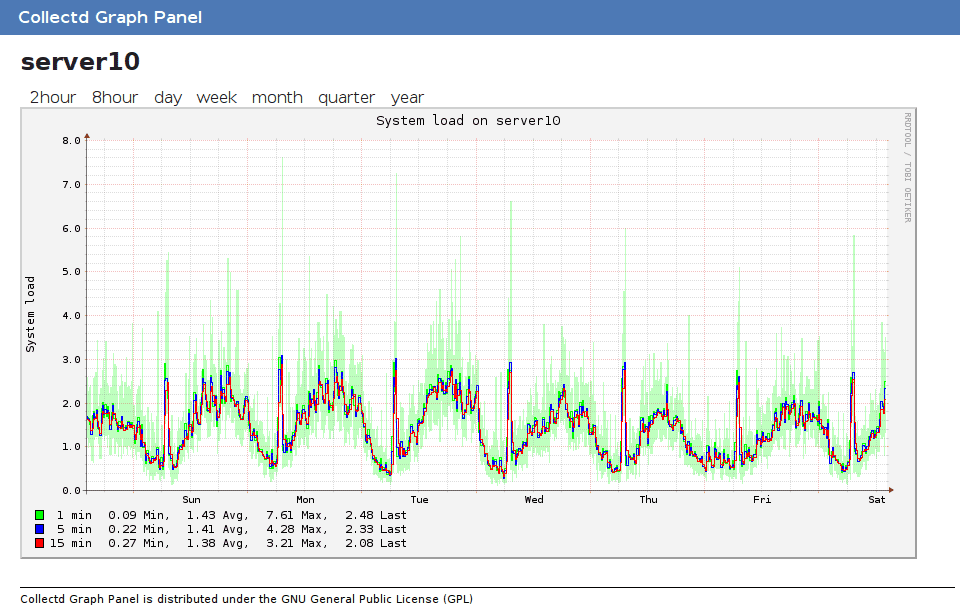
Collectd Graph Panel
Collectd is a daemon that collects system and application performance metrics periodically and provides mechanisms to store the values. It’s very lightweight and can run on virtually any system.
Practical Example: You can use it, for example, to monitor a small home network and collect data about network latency, bandwidth usage, and device status. Its main drawback, in my opinion, is that it’s just a collector and requires other tools to visualize and analyze the data.
Pro tip: Combine Collectd with a visualization tool like Grafana for a complete monitoring solution.
11. Sensu: An open-source monitoring event pipeline, ideal for cloud infrastructure
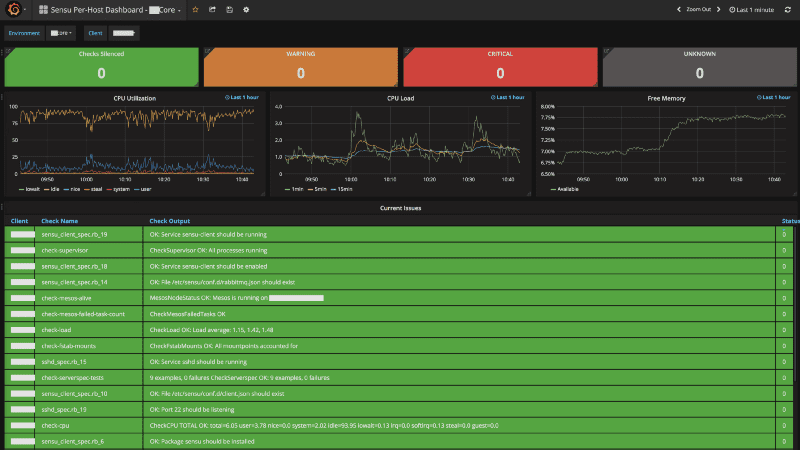
Sensu Dashboard
Sensu is an open-source monitoring event pipeline designed to automate your monitoring workflows. Whether you have a small or large-scale cloud infrastructure, Sensu provides a robust framework to observe, automate, and control everything.
Practical Example: Suppose you’re managing a large cloud environment that includes several different services. Sensu can not only monitor the status of these services but also automate reactions to certain events, like automatically restarting a failed service. One thing I personally appreciate about Sensu is its adaptability. But, it might be somewhat overwhelming if you’re a beginner.
Pro tip: Sensu integrates well with popular orchestration tools, so make sure to explore those connections for a smoother experience.
12. InfluxDB: A time series database designed to handle high write and query loads
Influxdb Dashboard
InfluxDB is designed to store large amounts of time-stamped data, making it ideal for monitoring applications, real-time analytics, and more. Its high-performance architecture can handle substantial write and query loads, allowing you to observe trends over time.
Practical Example: If you’re tracking user engagement on a website, InfluxDB can store all the related metrics, such as click-through rates, bounce rates, and time spent on the site. This gives you a comprehensive view of user behavior over time. While I love its efficiency, it may require some time to master, especially if you are new to time-series databases.
Pro tip: InfluxDB pairs well with Grafana for visualization, so consider this combination if you want to represent your data visually.
13. Fluentd: An open-source data collector for unified logging layer
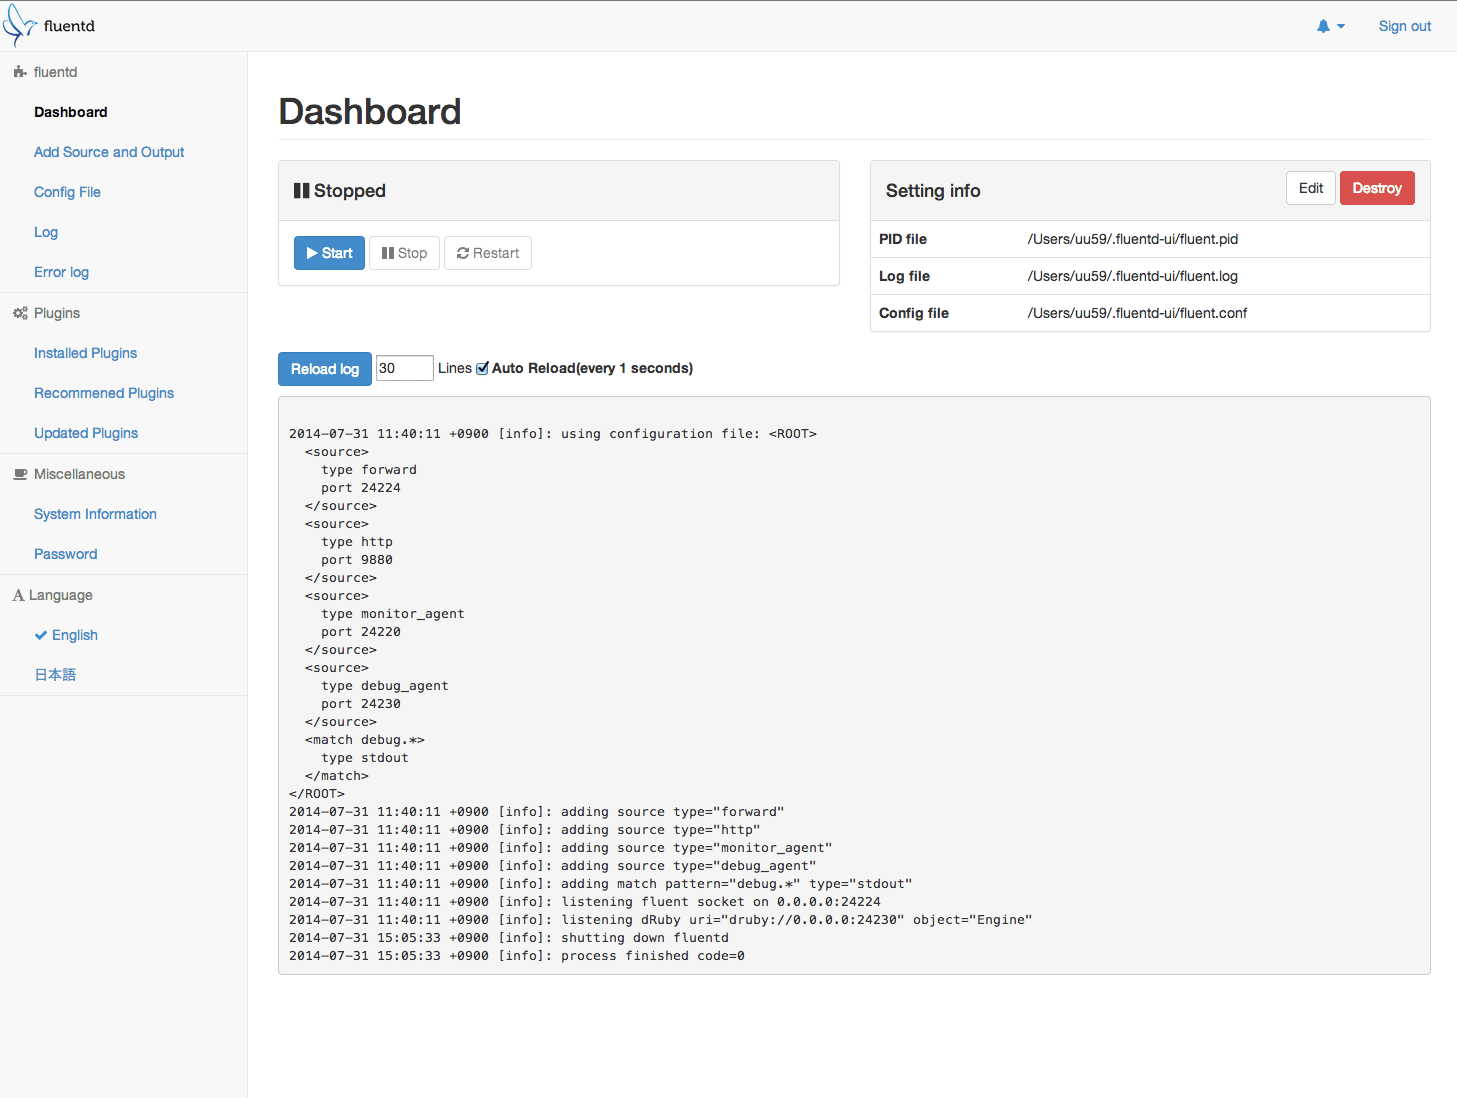
Fluentd Dashboard
Fluentd is an open-source tool that helps you unify your logging infrastructure. It allows you to collect logs from various sources and output them in numerous types of formats.
Practical Example: Consider a scenario where you have logs coming from web servers, databases, and applications. Fluentd can gather these logs, process them, and then send them to a centralized logging solution like Elasticsearch. Fluentd is incredibly versatile, but its configuration can be a bit tricky, which I find slightly frustrating at times.
Pro tip: Utilize Fluentd’s rich library of plugins to extend its functionality and adapt it to your specific needs.
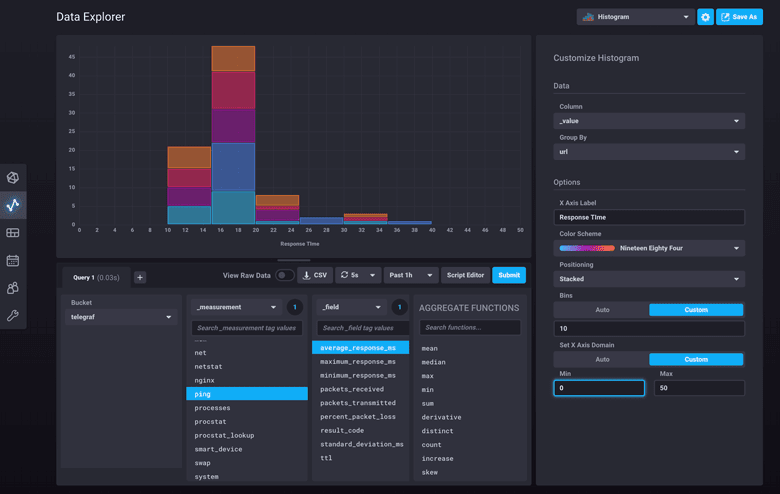
14. Telegraf: An agent for collecting, processing, aggregating, and writing metrics
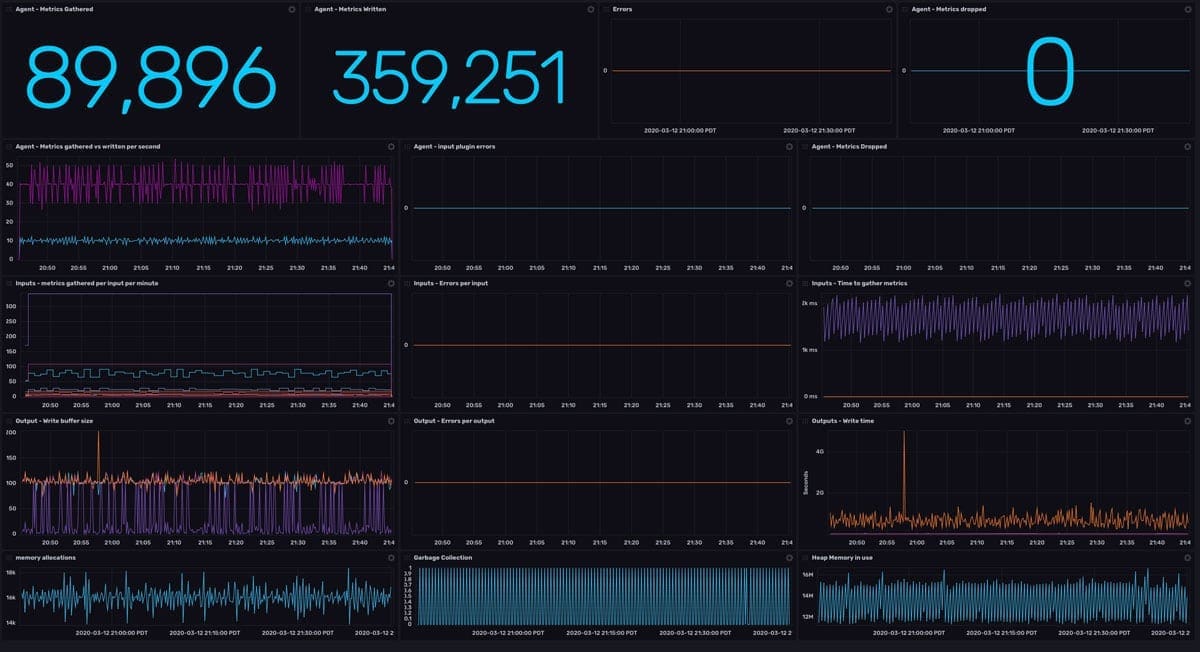
Telegraf monitoring dashboard
Telegraf is a plugin-driven server agent for collecting and sending various system metrics. It’s part of the InfluxData platform, which includes InfluxDB, and can handle a diverse set of metrics sources.
Practical Example: Imagine you’re monitoring the performance of several different applications running on diverse platforms. Telegraf can collect metrics from each of these applications and send them to InfluxDB, creating a unified monitoring platform. I appreciate its simplicity and flexibility, but it might not suit more complex use cases.
Pro tip: Explore Telegraf’s extensive plugin system to customize your monitoring setup exactly to your needs.
15. Logstash: A server-side data processing pipeline that ingests data from multiple sources, transforms it, and then sends it to your favorite “stash”
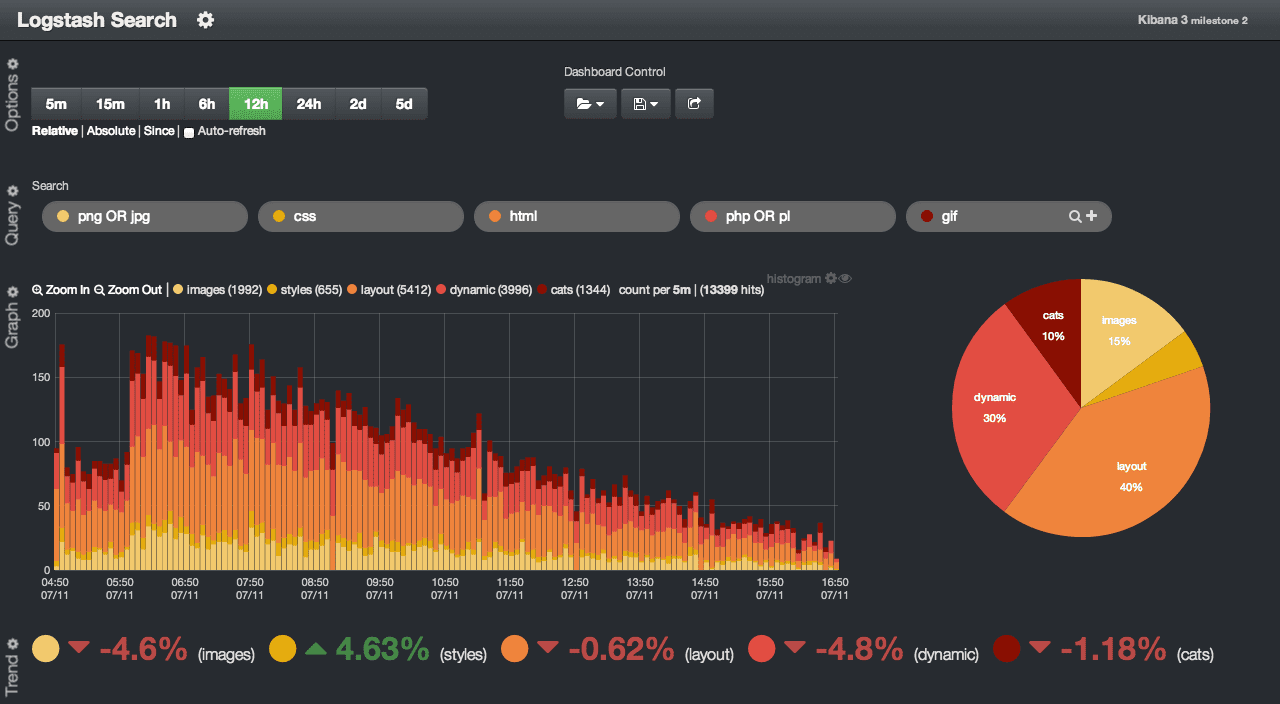
Logstash Dashboard
Logstash is a vital part of the ELK Stack and serves as a data processing pipeline. It can take data from almost any type of source, transform it on the fly, and send it to your desired destination.
Practical Example: If you are managing logs from multiple systems like web servers, security devices, and databases, Logstash can gather all these logs, normalize them into a consistent format, and send them to a central place like Elasticsearch. This makes analysis and troubleshooting much easier. Though powerful, Logstash can be resource-intensive, a downside that has been a pain point in my experience.
Pro tip: If you’re using Logstash in a larger environment, make sure to monitor and fine-tune its performance regularly to avoid any resource bottlenecks.
Conclusion
Selecting the right tool depends on your specific needs. All the tools mentioned above have their strengths and weaknesses, and the best way to find the right one is by defining your requirements clearly. What’s vital is to understand that no single tool can solve all your problems, but a combination of tools often provides the best solution.
And as a final piece of advice from someone who’s been in the trenches: it’s not just about setting up these tools, but maintaining and understanding them is what truly makes the difference. Don’t just set it and forget it—make monitoring a crucial part of your everyday workflow. Because in today’s fast-paced digital world, staying ahead means staying informed.