
Performance is one of the most complicated parts of systems administration. Whenever you are trying to investigate the source of bad performance or the reason for the high workload, you need the right tools to do so.
Perf is one of those tools. It’s a performance counter for Linux that you can use to gather data about performance of your system.
We will see how to install it on Ubuntu and Centos and will do a small walkthrough of the basic command usage.
Installing Perf on Ubuntu
Perf is part of the package ‘linux-tools’ in Ubuntu and it is installed like any other package using apt. Just make sure you have sources updated.
sudo apt update
First, install package linux-tools-common:
sudo apt install linux-tools-common
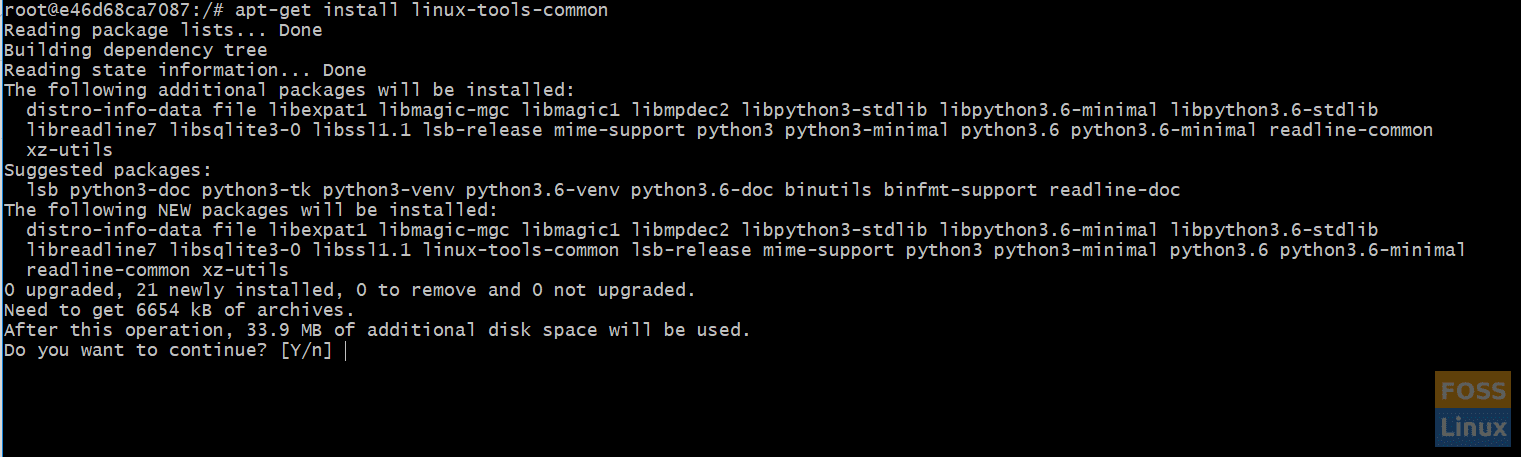
Linux Tools Common Installation
Next, you need to specific package for your running kernel. To get the exact version of your kernel, use the following command:
uname -r
You will get the exact kernel version.

Getting kernel version in Linux
You can install the specific linux-tools package or if there is no specific version of the package for your kernel, you can use the linux-tools-generic package. But this might not work as expected. As a rule of thumb, perf won’t work or won’t work as intended, if the linux-tools package does not match the running (very important! the running, not the installed) version of Linux kernel.
Installing Perf on CentOS
As usual, package names vary from CentOS to Ubuntu but the procedure is basically the same, first update package information:
yum update
There is a straight package that will trigger all dependencies in CentOS.
yum install perf
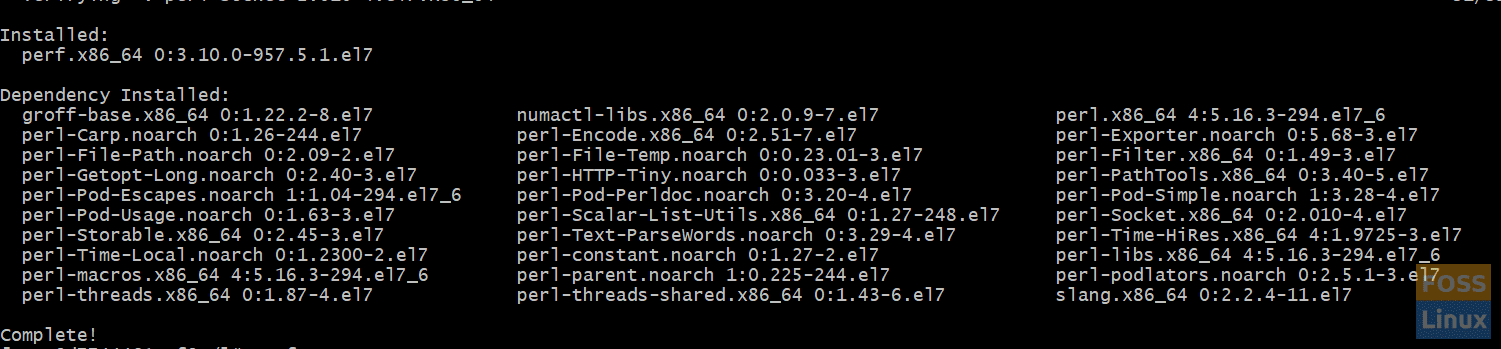
Perf installation summary in CentOS
Basic usage of Perf Command
Let us see some basic commands on how to use perf. The most basic usage of perf is, of course, help page, with “–help” flag to see command summary
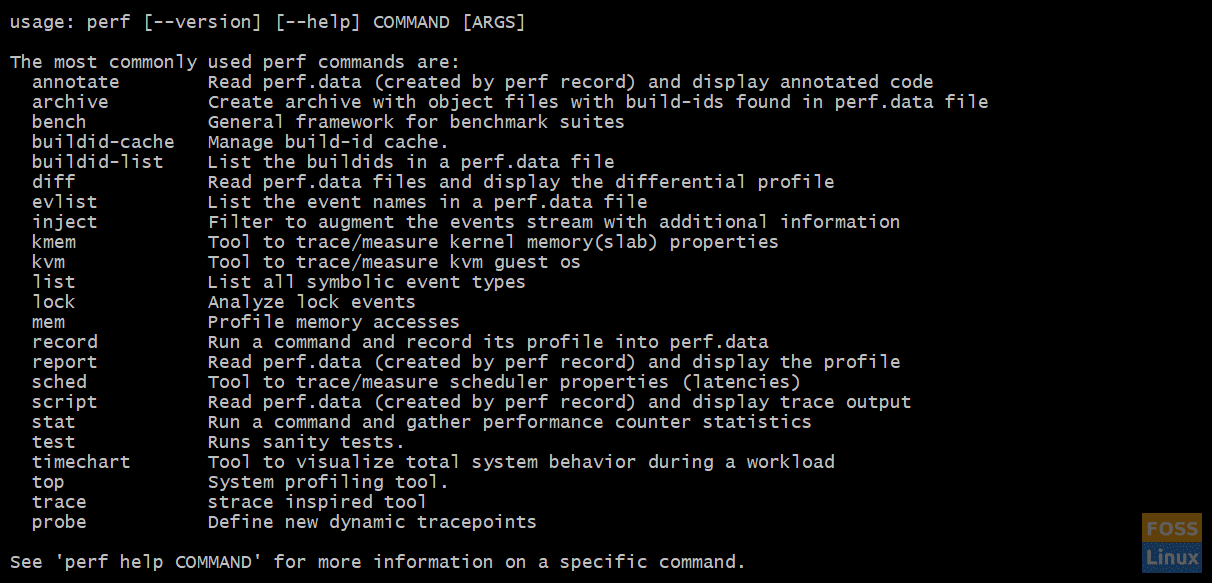
Perf Usage Summary
Depending on your system configuration, some commands of perf might be limited by security policies. To disable those policies just use:
echo 0 > /proc/sys/kernel/perf_event_paranoid
There are two big groups of commands: commands that are run over live system and commands that are run over a performance record.
Commands over a live system
perf list [category]
The above command lists all the available event types in the system. This is a long list and depending on the system configuration, it will be wrapped by less/more. If you provide a category value, only events on this category will be shown.
Available categories are: hw|sw|cache|tracepoint|pmu|event_glob
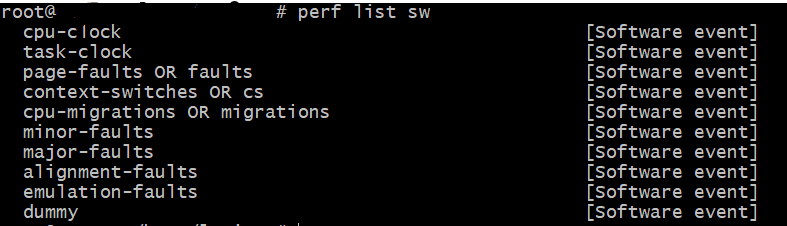
Available software events in Perf
perf bench <category> <benchmark>
The above command makes several benchmarks on the system. They are split amongst different categories (sched, mem, numa, futex, all) and each category has a different list of benchmarks.
If you want to check all memory speed tests, use the below command:
perf bench mem all
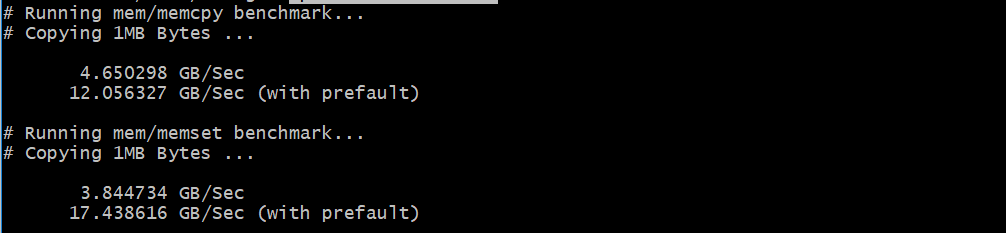
Perf memory benchmark result
perf stat <command>
The above command will return the performance stats. It will output something like this
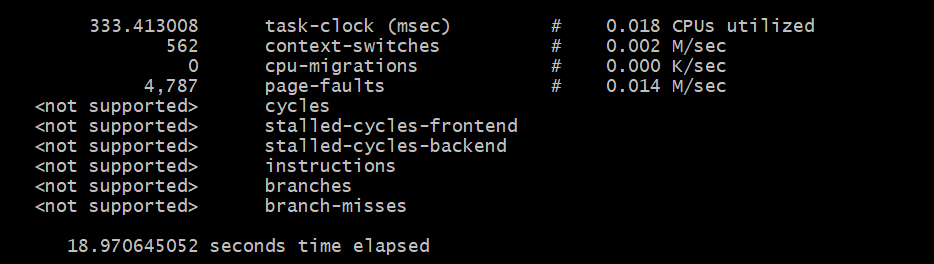
Results of perf stat execution
perf top
This will display a live analysis of system profile, like top, but more fine-tuned.
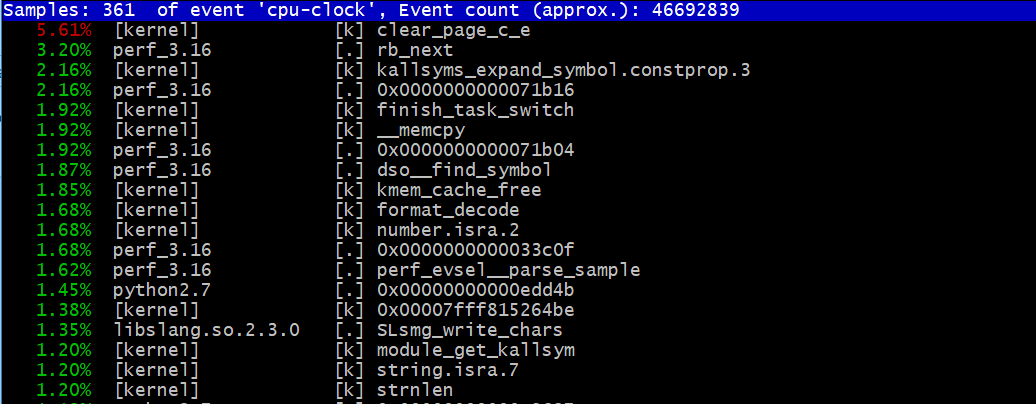
Example screen of perf top output
Here starts the second group of commands.
Commands over a Performance record
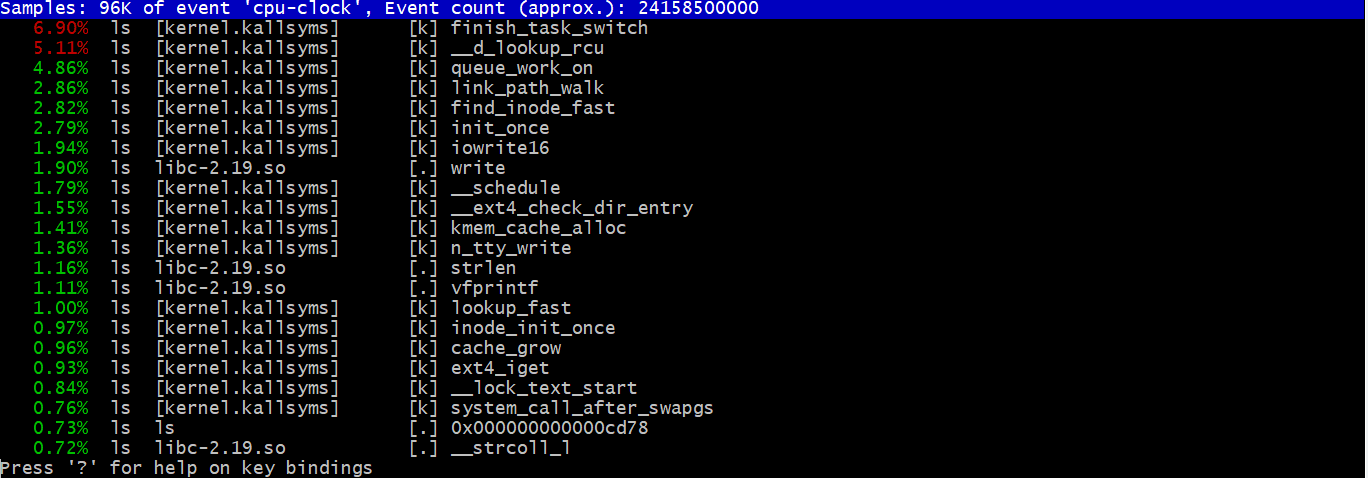
You can record a performance profile of any command you execute using the following command line:
perf record [options]

Result of perf record for ls -laR
This will produce a raw performance registers record. How deep this record is, will depend on the installation of your system. You might need debug or dev packages to get all the profiling data you might get. There are also a lot of flags that will allow us to control what will be profiled, how it will be saved and how often it will be profiled.
Once we have the performance record, there are several commands to act with this data, the easiest one is as follows:
perf report -i <perf file> [options]
Result of perf report on ls -laR command
This will generate a report of the performance file. We can select how to split or sort the data or which data we want in the report.
perf diff <datafile 1> <datafile 2> …
This will allow us to compare two executions, for example, if we want to know how the program is running after changing parameters compared with base execution.
perf lock -I <perf file>
This will analyze all lock events in a previously recorded performance file.
perf mem -t <Type> [ record <command> | report ]
This will record or report from a record, profiling on memory access of the type selected.
perf timechart
This will make a time chart of the execution of previously recorded profiling.
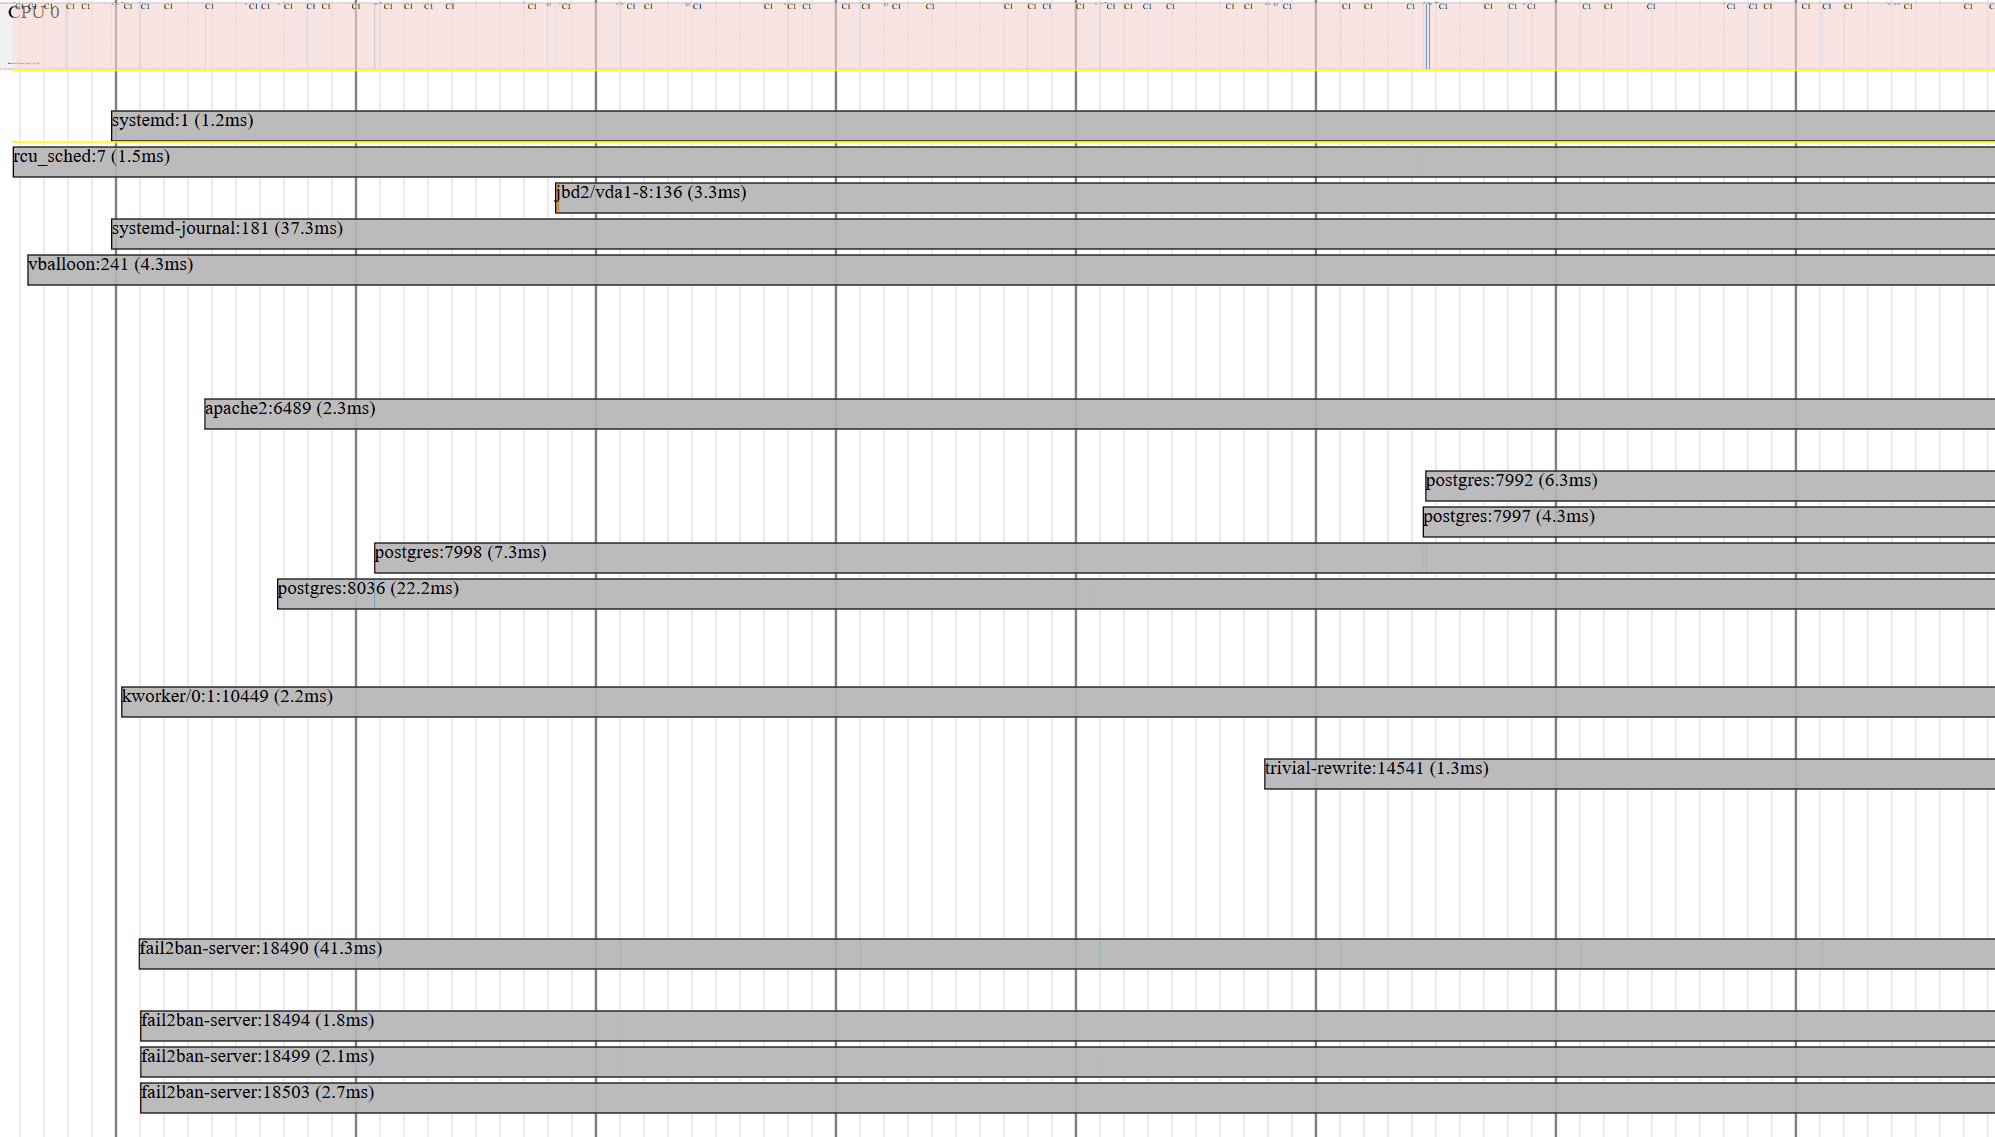
Partial output of perf time chart
With all these tools in our hand, you can start checking what’s going on in your server, you can start doing profiles of executions to test different configurations and you will be armed with a vast set of tools to get control of the performance on your system.