
Prometheus is an open-source toolkit initially built at SoundCloud for monitoring and alerting. The toolkit is now a standalone open source project and maintained independently of any company.
The toolkit collects metrics from monitored targets by scrapping HTTP endpoints on those targets. Most Prometheus components are in Go. Some written in Java, Python, and Ruby.
Prometheus works well to record any numerical time series. It fits both machine-centric monitoring and high-dynamic service-oriented architecture monitoring. In addition to making it easier to run and integrate into your environment, Prometheus offers a rich data model and query language.
The following tutorial shows steps to install Prometheus on CentOS.
Install and Configure Prometheus on CentOS 7
Login to Terminal as root, and start firing the commands below.
Step 1 – Update System
yum update -y
Step 2 – Disable SELinux
Open SELinux configuration and edit the file:
vim /etc/sysconfig/selinux
Change “SELINUX=enforcing” to “SELINUX=disabled”.
Save and exit the file. Then reboot the system.
reboot
Step 3 – Download Prometheus package
Go to official Prometheus downloads page, and copy the URL of Linux “tar” file.
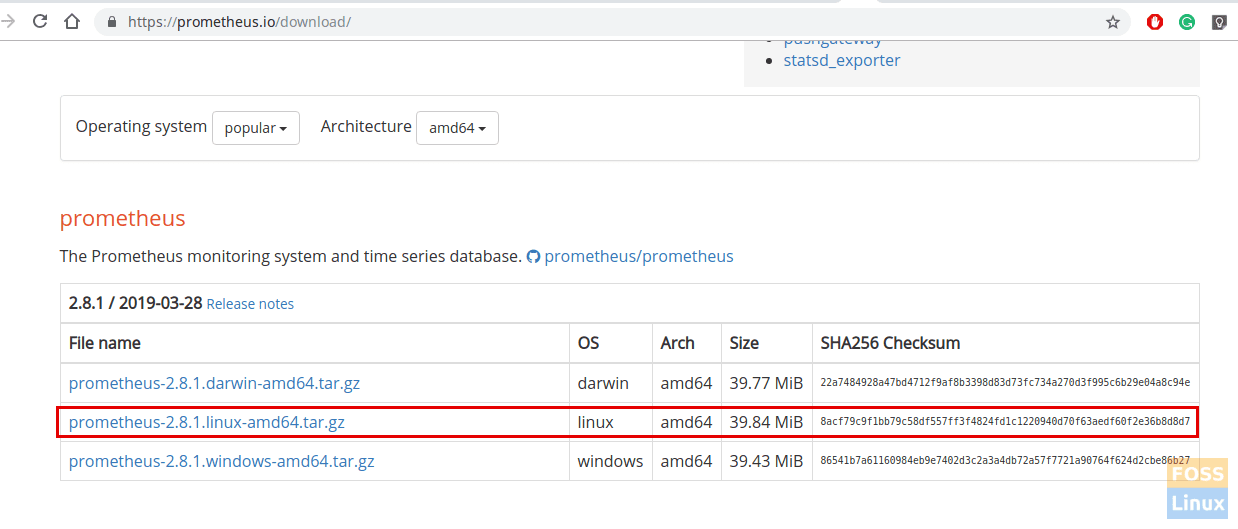
Prometheus Download Page
Run the following command to download package. Paste the copied URL after wget in the below command:
wget https://github.com/prometheus/prometheus/releases/download/v2.8.1/prometheus-2.8.1.linux-amd64.tar.gz
Step 4 – Configure Prometheus
Add a Prometheus user.
useradd --no-create-home --shell /bin/false prometheus
Create needed directories.
mkdir /etc/prometheus
mkdir /var/lib/prometheus
Change the owner of the above directories.
chown prometheus:prometheus /etc/prometheus
chown prometheus:prometheus /var/lib/prometheus
Now go to Prometheus downloaded location and extract it.
tar -xvzf prometheus-2.8.1.linux-amd64.tar.gz
Rename it as per your preference.
mv prometheus-2.8.1.linux-amd64 prometheuspackage
Copy “prometheus” and “promtool” binary from the “prometheuspackage” folder to “/usr/local/bin”.
cp prometheuspackage/prometheus /usr/local/bin/
cp prometheuspackage/promtool /usr/local/bin/
Change the ownership to Prometheus user.
chown prometheus:prometheus /usr/local/bin/prometheus
chown prometheus:prometheus /usr/local/bin/promtool
Copy “consoles” and “console_libraries” directories from the “prometheuspackage” to “/etc/prometheus folder”
cp -r prometheuspackage/consoles /etc/prometheus
cp -r prometheuspackage/console_libraries /etc/prometheus
Change the ownership to Prometheus user
chown -R prometheus:prometheus /etc/prometheus/consoles
chown -R prometheus:prometheus /etc/prometheus/console_libraries
Add and modify Prometheus configuration file.
Configurations should be added to the “/etc/prometheus/prometheus.yml”
Now we will create the prometheus.yml file.
vim /etc/prometheus/prometheus.yml
Add the following configuration to the file.
global:
  scrape_interval: 10s

scrape_configs:
  - job_name: 'prometheus_master'
    scrape_interval: 5s
    static_configs:
      - targets: ['localhost:9090']
save and exit the file
Change the ownership of the file.
chown prometheus:prometheus /etc/prometheus/prometheus.yml
Configure the Prometheus Service File.
vim /etc/systemd/system/prometheus.service
Copy the following content to the file.
[Unit]
Description=Prometheus
Wants=network-online.target
After=network-online.target

[Service]
User=prometheus
Group=prometheus
Type=simple
ExecStart=/usr/local/bin/prometheus \
--config.file /etc/prometheus/prometheus.yml \
--storage.tsdb.path /var/lib/prometheus/ \
--web.console.templates=/etc/prometheus/consoles \
--web.console.libraries=/etc/prometheus/console_libraries

[Install]
WantedBy=multi-user.target
Save and the exit file.
Reload the systemd service.
systemctl daemon-reload
Start the Prometheus service.
systemctl start prometheus
Check service status.
systemctl status prometheus
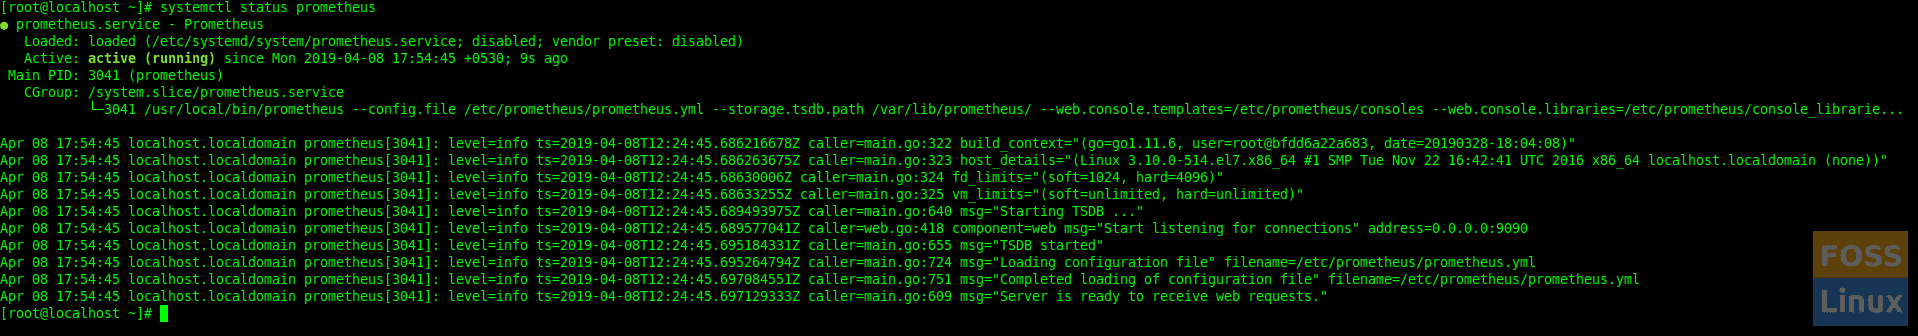
Status
Add firewall rules.
firewall-cmd --zone=public --add-port=9090/tcp --permanent
Reload firewall service.
systemctl reload firewalld
Step 5 – Access Prometheus Web Interface
Use the following Url to access UI.
http://Server-IP:9090/graph
Then you can see the following interface.
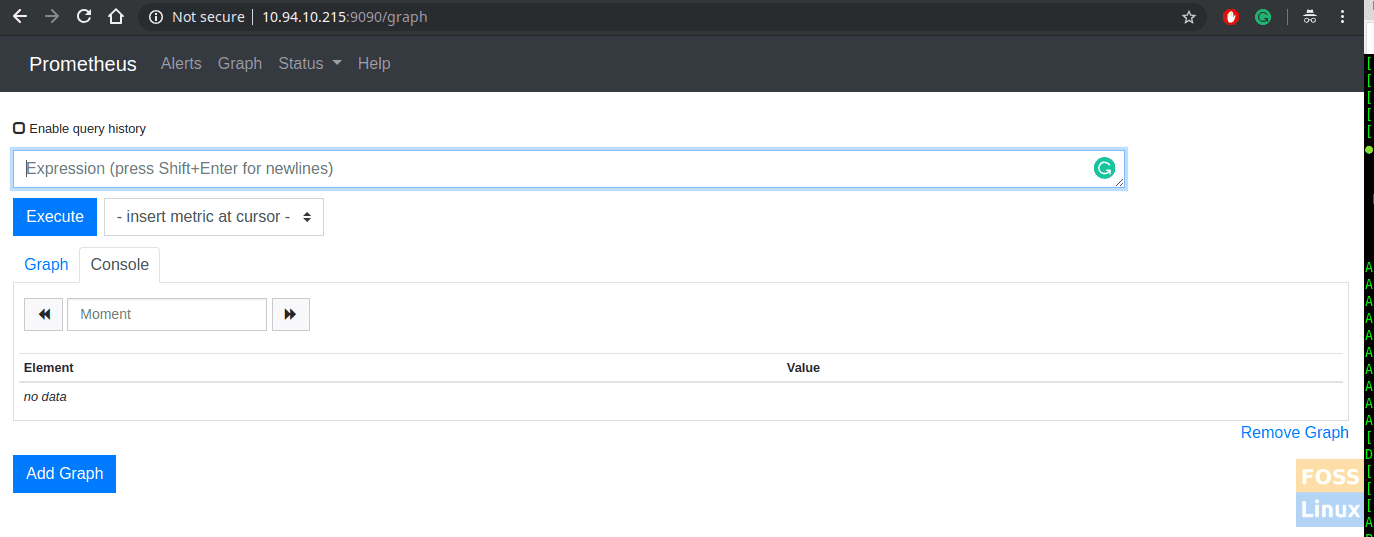
UI
Step 6 – Monitor Linux Server Using Prometheus
First, you need to configure Prometheus node exporter on a Linux server.
Copy URL of the Node Exporter form the official download page.
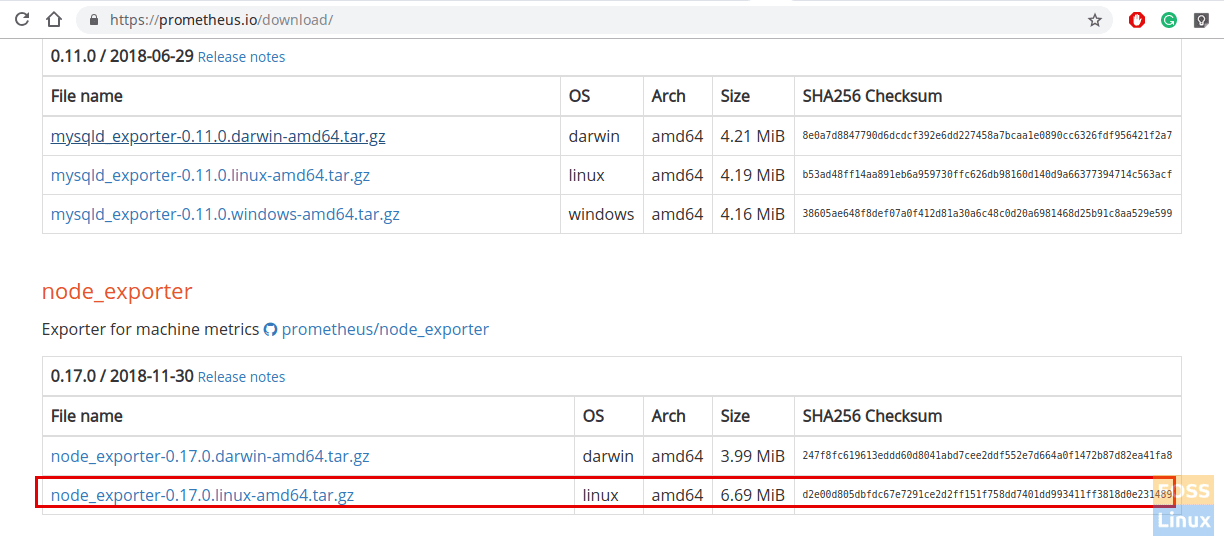
Node Exporter Download
Paste the copied URL after wget in the following command:
wget https://github.com/prometheus/node_exporter/releases/download/v0.17.0/node_exporter-0.17.0.linux-amd64.tar.gz
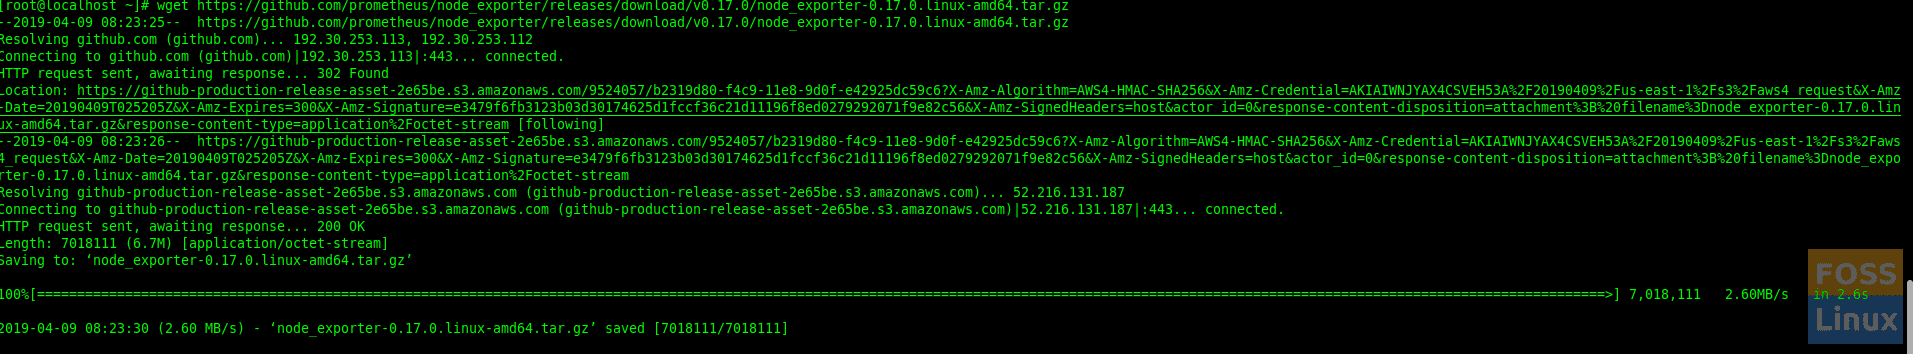
Node Exporter
Extract the downloaded package.
tar -xvzf node_exporter-0.17.0.linux-amd64.tar.gz
Create a user for the node exporter.
useradd -rs /bin/false nodeusr
Move binary to “/usr/local/bin” from the downloaded extracted package.
mv node_exporter-0.17.0.linux-amd64/node_exporter /usr/local/bin/
Create a service file for the node exporter.
vim /etc/systemd/system/node_exporter.service
Add the following content to the file.
[Unit]
Description=Node Exporter
After=network.target

[Service]
User=nodeusr
Group=nodeusr
Type=simple
ExecStart=/usr/local/bin/node_exporter

[Install]
WantedBy=multi-user.target
Save and exit the file.
Reload the system daemon.
systemctl daemon-reload
Start node exporter service.
systemctl start node_exporter
Add a firewall rule to allow node exporter.
firewall-cmd --zone=public --add-port=9100/tcp --permanent
Reload firewall service.
systemctl restart firewalld
Enable node exporter on system boot.
systemctl enable node_exporter
View the metrics browsing node exporter URL.
http://IP-Address:9100/metrics
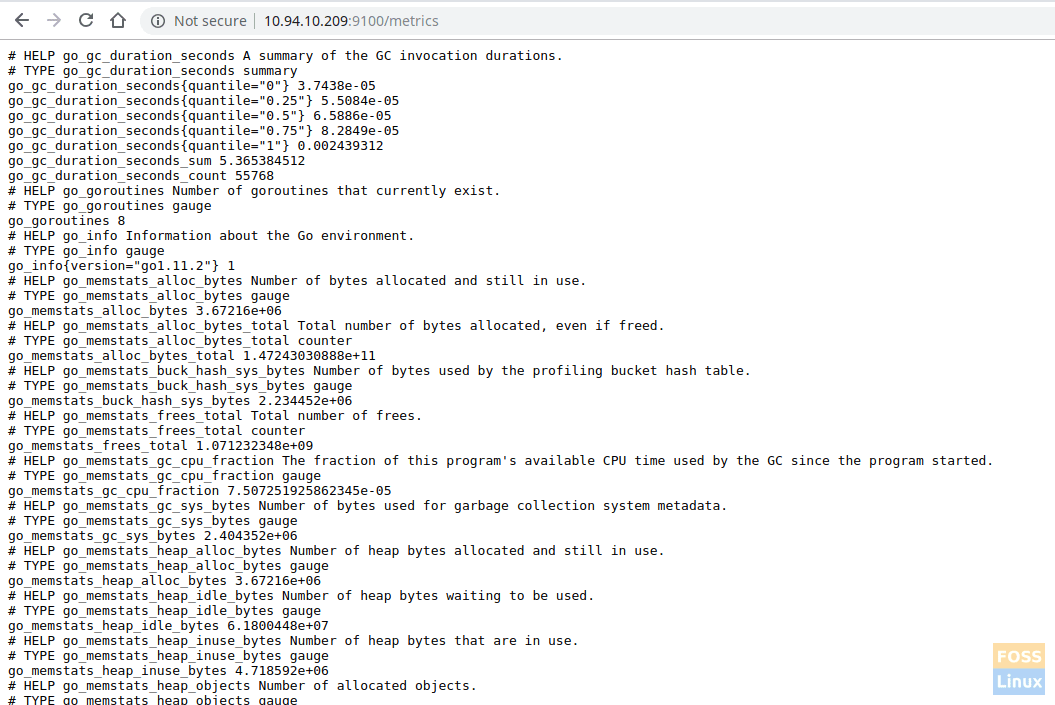
Node Exporter Metrics
Add configured node exporter Target On Prometheus Server.
Login to Prometheus server and modify the prometheus.yml file
Edit the file:
vim /etc/prometheus/prometheus.yml
Add the following configurations under the scrape config.
 - job_name: 'node_exporter_centos'
    scrape_interval: 5s
    static_configs:
      - targets: ['10.94.10.209:9100']
The file should look like as follows.
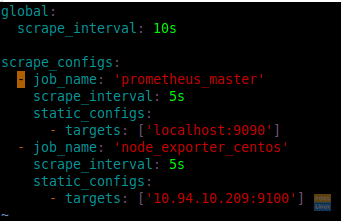
Modified File
Restart Prometheus service.
systemctl restart prometheus
Login to Prometheus server web interface, and check targets.
http://Prometheus-Server-IP:9090/targets
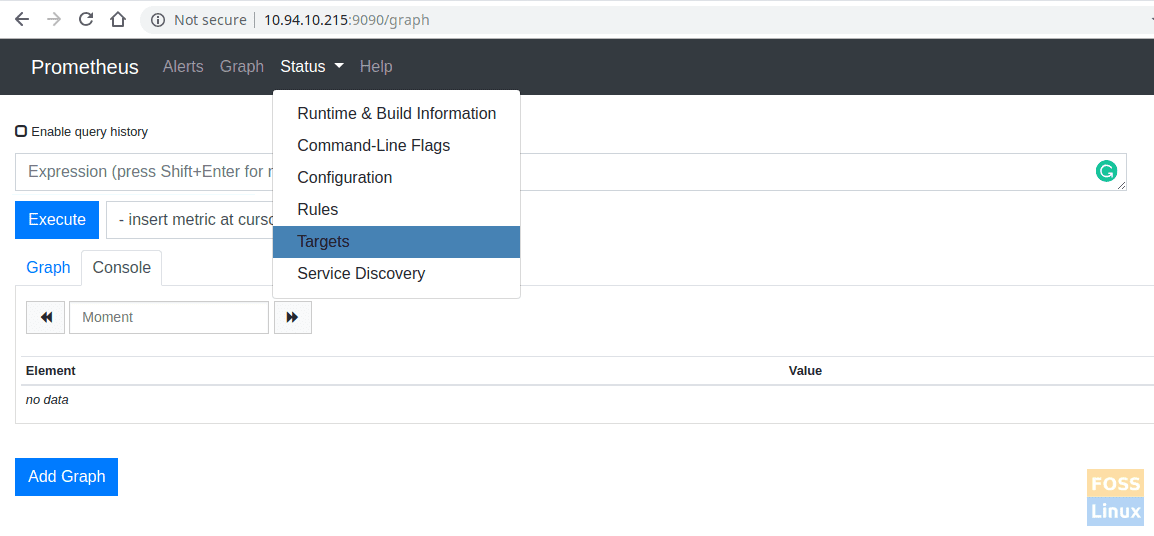
Added Target
You can click the graph and query any server metrics and click execute to show output. It will show the console output.
Query Browser:
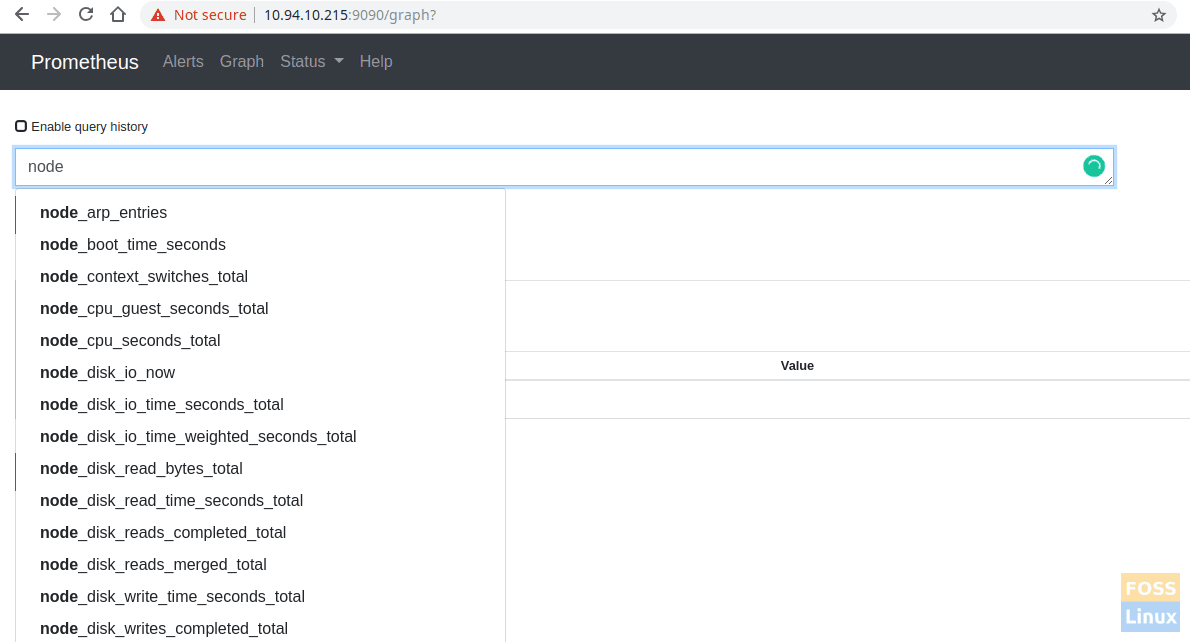
Select Query
Console output:
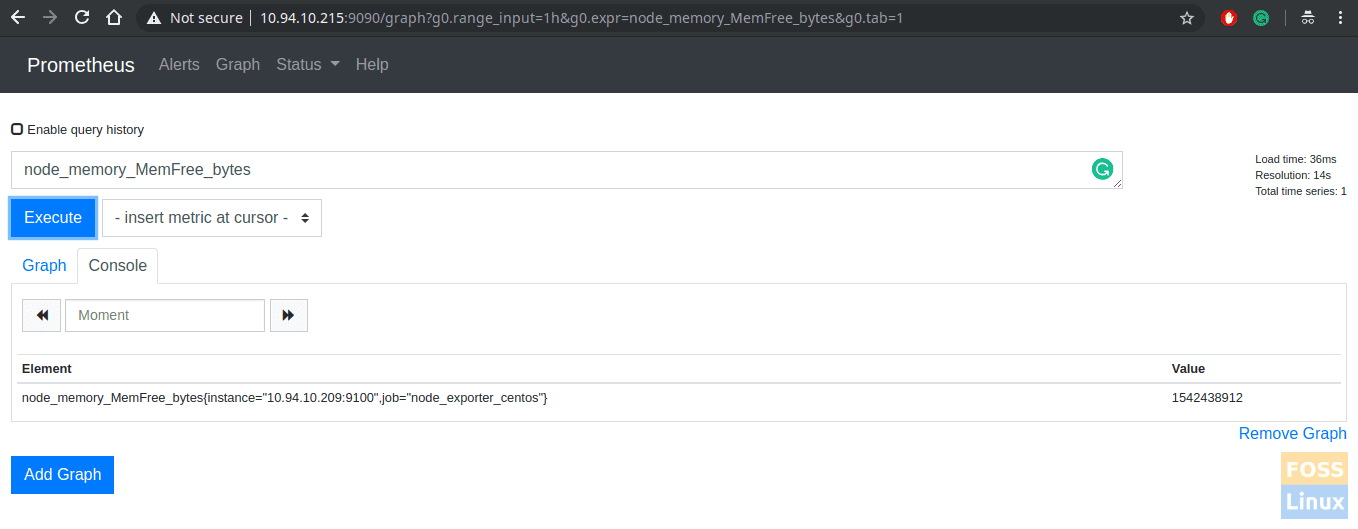
Memory Console Output
Click Graph to view.
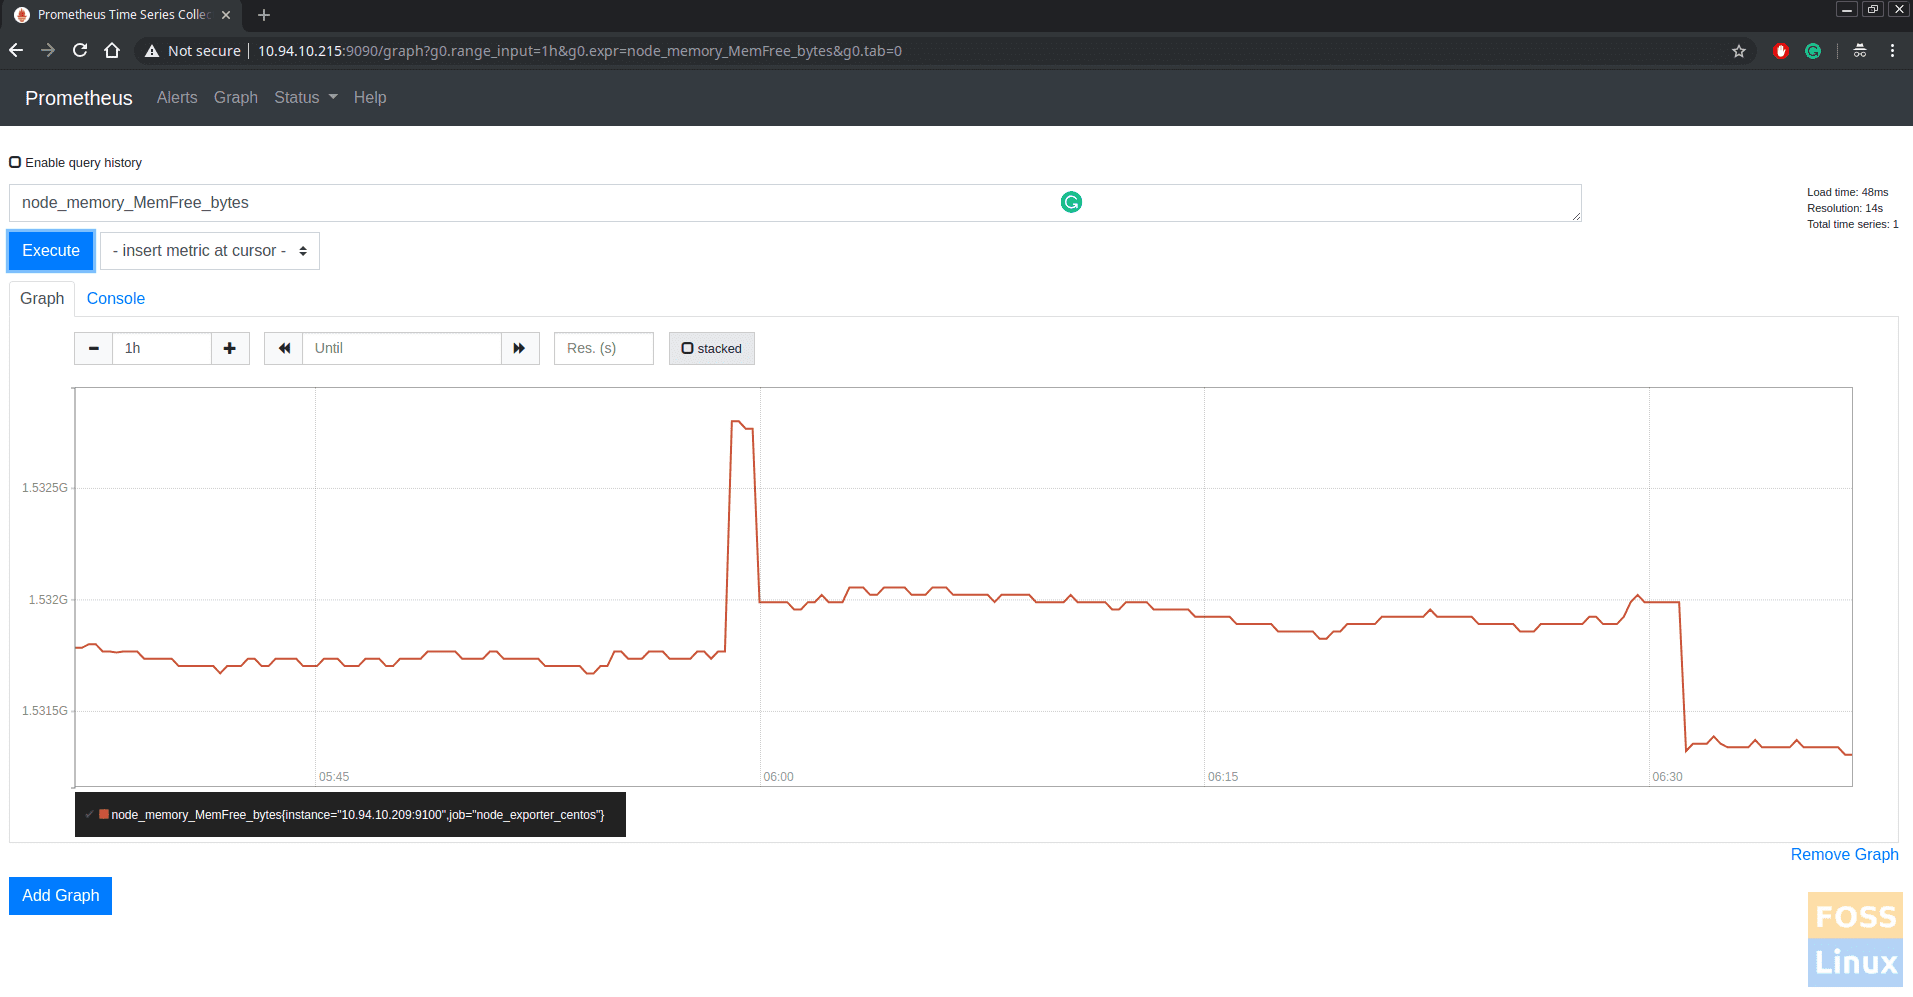
Memory Graph
Step 7 – Monitor MySQL Server Using Prometheus
Login to MySQL and execute the following queries.
CREATE USER 'mysqlexporter'@'localhost' IDENTIFIED BY 's56fsg#4W2126&dfk' WITH max_user_connections 2;
GRANT PROCESS, REPLICATION CLIENT, SELECT ON *.* TO 'mysqlexporter'@'localhost';
FLUSH PRIVILEGES;
Download mysqld_exporter from the official download page.
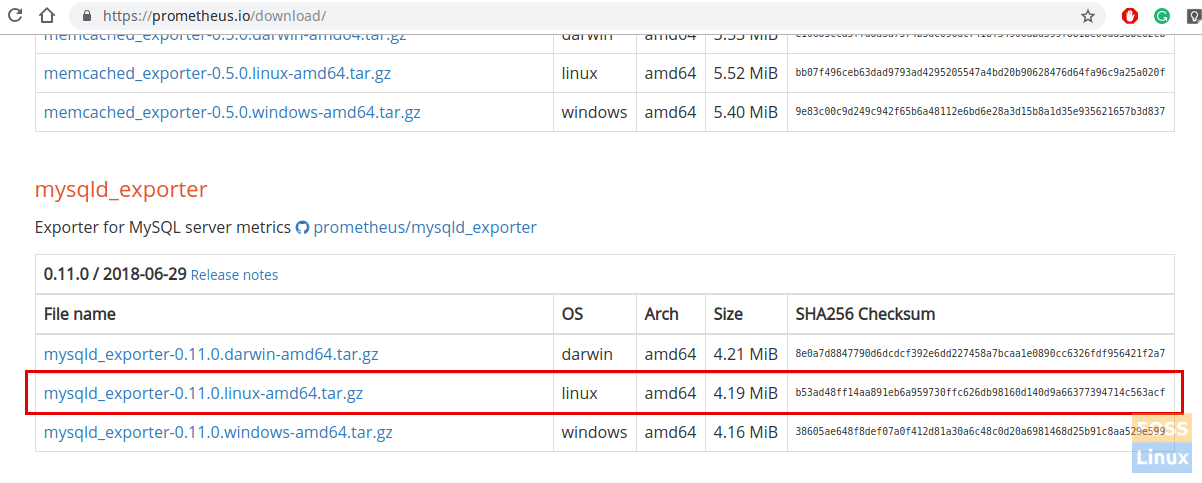
Mysqld Exporter
wget https://github.com/prometheus/mysqld_exporter/releases/download/v0.11.0/mysqld_exporter-0.11.0.linux-amd64.tar.gz
Extract the Downloaded file.
tar -xvzf mysqld_exporter-0.11.0.linux-amd64.tar.gz
Add a user for mysqld_exporter.
useradd -rs /bin/false mysqld_exporter
Copy mysqld_exporter file to /usr/bin.
mv mysqld_exporter-0.11.0.linux-amd64/mysqld_exporter /usr/bin
Change ownership of the file.
chown mysqld_exporter:mysqld_exporter /usr/bin/mysqld_exporter
Create needed folders.
mkdir -p /etc/mysql_exporter
Create a MySQL password file for mysqld_exporter.
vim /etc/mysql_exporter/.my.cnf
Add the following configurations to the file.
[client]
user=mysqlexporter
password=sdfsg#4W2126&gh
Save and exit the file.
Change ownership.
chown -R mysqld_exporter:mysqld_exporter /etc/mysql_exporter
Grant needed permission.
chmod 600 /etc/mysql_exporter/.my.cnf
Create a service file.
vim /etc/systemd/system/mysql_exporter.service
Add the following content to the file.
[Unit]
Description=MySQL Server fosslinux
After=network.target

[Service]
User=mysqld_exporter
Group=mysqld_exporter
Type=simple
ExecStart=/usr/bin/mysqld_exporter \
--config.my-cnf="/etc/mysql_exporter/.my.cnf"
Restart=always

[Install]
WantedBy=multi-user.target
Reload the system daemon.
systemctl daemon-reload
Enable mysql_exporter on system boot.
systemctl enable mysql_exporter
Start service.
systemctl start mysql_exporter
View the metrics using the following URL.
http://Server_IP:9104/metrics
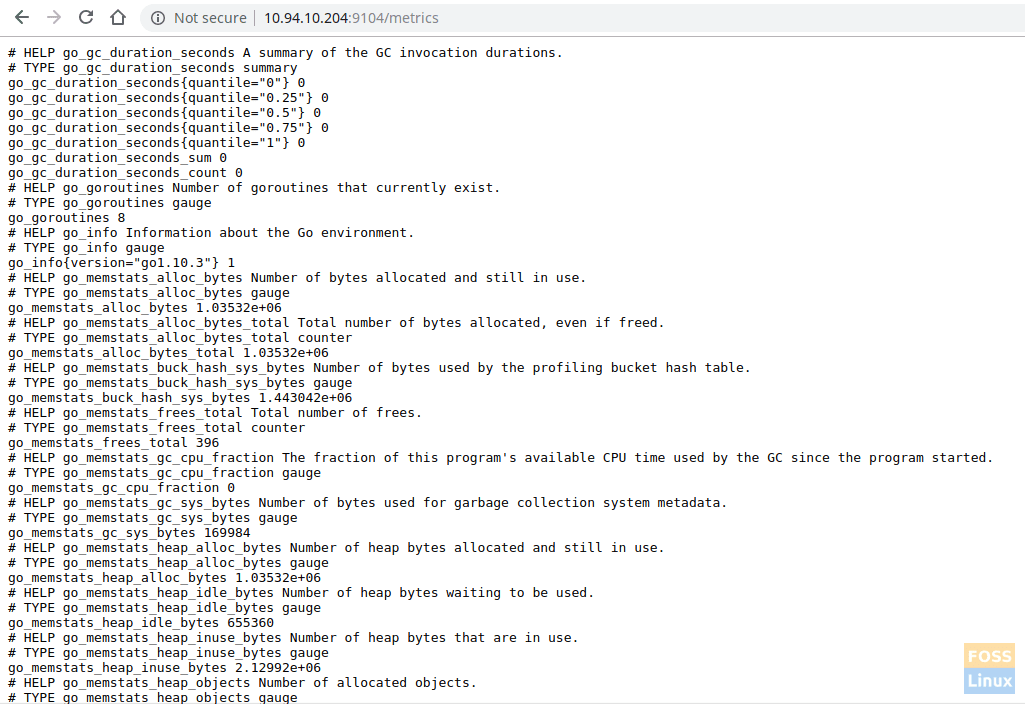
View Metrics
Now go to Prometheus server and modify the prometheus.yml file.
vim /etc/prometheus/prometheus.yml
Add the following content to the file.
- job_name: 'mysql_exporter_fosslinux'
    scrape_interval: 5s
    static_configs:
      - targets: ['10.94.10.204:9104']
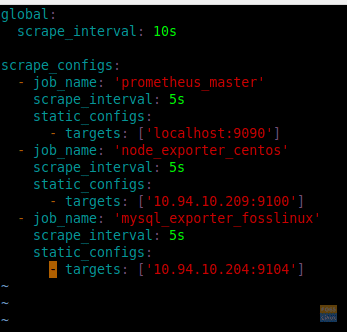
Edited File
Restart Prometheus.
systemctl restart prometheus
You can see added targets by clicking targets under the status.
http://IP:9090/targets
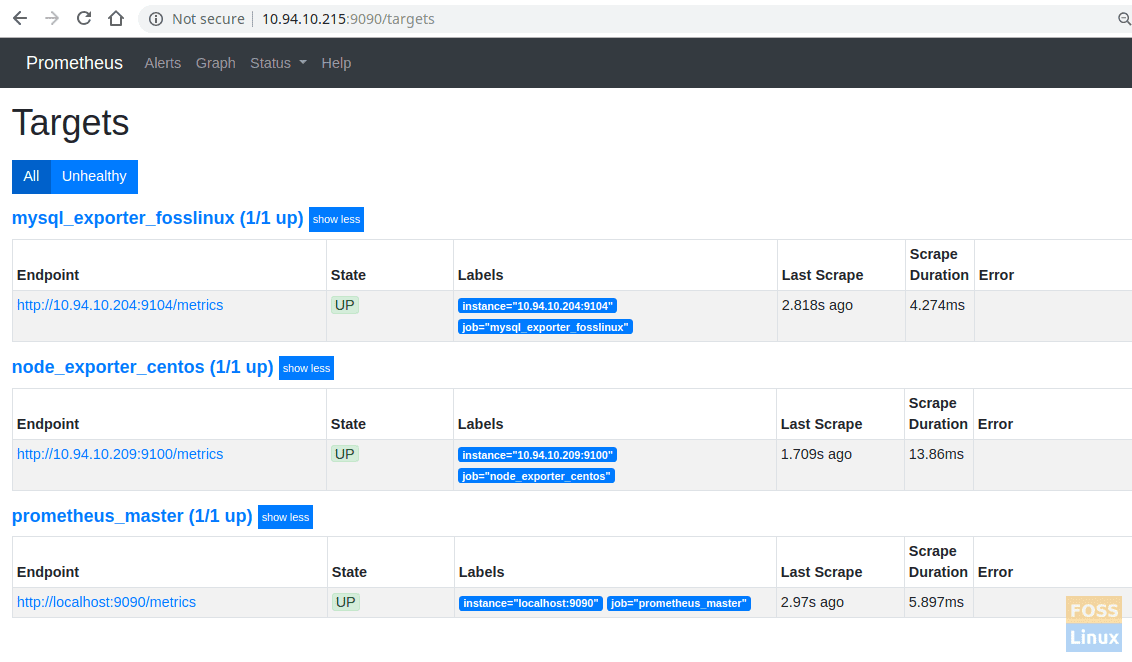
All Targets
Now you can select query using query browser and get the result of MySQL server.
That’s all about the installation and configuration of Prometheus server on CentOS 7. Hope you enjoyed this tutorial. Let us know your feedback in the comments below.
22 comments
Great Article.
Thanks Darshana.
Hope you’ll more articles like this in the future.
Absolutely brilliant article Darshana,
Saved me a lot of time and effort just following this through and worked like a charm.
Thanks for taking the time to publish.
I have two errors when trying to follow this tutorial.
1. When I added your version of the prometheus.yml Prometheus would not start. Using the default included in the Prometheus-2.13.0.linux-amd64 tar did work however.
2. When it came time to add the node_exporter ( I have version 0.18.1.linux-amd64) adding the portion outlined above the prometheus service fails there as well. I did change the configured IP to both mine as well as localhost, neither of which worked. The error message from systemctl status prometheus is as follows:
prometheus.service – Prometheus
Loaded: loaded (/etc/systemd/system/prometheus.service; disabled; vendor preset: disabled)
Active: failed (Result: exit-code) since Tue 2019-10-15 16:28:56 CEST; 7s ago
Process: 2756 ExecStart=/usr/local/bin/prometheus –config.file /etc/prometheus/prometheus.yml –storage.tsdb.path /var/lib/prometheus/ –web.console.templates=/etc/prometheus/consoles –web.console.libraries=/etc/prometheus/console_libraries (code=exited, status=1/FAILURE)
Main PID: 2756 (code=exited, status=1/FAILURE)
Can u share ur prometheus.yml file? Seems it has the issue
Thanks, really helped me lot.
Hi, I am getting this error when i am starting Prometheus :
prometheus: level=error caller=main.go:717 err=”opening storage failed: lock DB directory: open /data/lock: permission denied”
I get this one when i am starting node_exporter:
Failed at step USER spawning /usr/local/bin/node_exporter: No such process
Hi Guys,
Here is the correct service file as “=” is missing:
[Unit]
Description=Prometheus
Wants=network-online.target
After=network-online.target
[Service]
User=prometheus
Group=prometheus
Type=simple
ExecStart=/usr/local/bin/prometheus
–config.file=/etc/prometheus/prometheus.yml
–storage.tsdb.path=/var/lib/prometheus/
–web.console.templates=/etc/prometheus/consoles
–web.console.libraries=/etc/prometheus/console_libraries
[Install]
WantedBy=multi-user.target
Hi,
Can anyone suggest on below error
prometheus.service: main process exited, code=exited, status=2/INVALIDARGUMENT
I had same issue, just put one more space before “- job_name: ‘node_exporter_centos'” in prometheus.service
it should have two space, not TAB, just space
it worked for me when I corrected the config “file /etc/systemd/system/prometheus.service” as follows:
[Unit]
Description=Prometheus Monitoring
Wants=network-online.target
After=network-online.target
[Service]
User=prometheus
Group=prometheus
Type=simple
ExecStart=/usr/local/bin/prometheus \
–config.file /etc/prometheus/prometheus.yml \
–storage.tsdb.path /var/lib/prometheus/ \
–web.console.templates=/etc/prometheus/consoles \
–web.console.libraries=/etc/prometheus/console_libraries
ExecReload=/bin/kill -HUP $MAINPID
[Install]
WantedBy=multi-user.target
I mean I have added “\” (for back to line) at the end of the fourth until seventh lines in the file “/etc/systemd/system/prometheus.service”
Hmm, I run LSI megaRAID controllers on all of my remote linux nodes. How would I get it to alert me of any LSI errors or if the controller goes from “optimal” to “degraded”
Hi guys, the tutorial helped me but when I add the node_exporter I get the following error
Active: failed (Result: exit-code) since mié 2020-01-29 14:40:52 -04; 20min ago
Process: 9715 ExecStart=/usr/local/bin/prometheus –config.file /etc/prometheus/prometheus.yml –storage.tsdb.path /var/lib/prometheus/ –web.console.templates=/etc/prometheus/consoles –web.console.libraries=/etc/prometheus/console_libraries (code=exited, status=1/FAILURE)
Main PID: 9715 (code=exited, status=1/FAILURE)
This is my prometheus.yml
global:
scrape_interval: 10s
scrape_configs:
– job_name: ‘prometheus’
scrape_interval: 5s
static_configs:
– targets: [‘localhost:9090’]
– job_name: ‘node_exporter’
scrape_interval: 5s
static_configs:
– targets: [‘172.16.2.10:9100’]
Any suggestions to solve?
Hello, right alignement in text solve the issue from my side.
global:
scrape_interval: 10s
scrape_configs:
– job_name: prometheus_master
scrape_interval: 5s
static_configs:
– targets: [‘localhost:9090’]
– job_name: node_exporter_centos
scrape_interval: 5s
static_configs:
– targets: [‘localhost:9100’]
It’s RIGHT and full!
# mysql -u root -p
> CREATE USER ‘mysqld_exporter’@’localhost’ IDENTIFIED BY ‘password’ WITH MAX_USER_CONNECTIONS 3;
> GRANT PROCESS, REPLICATION CLIENT, SELECT ON *.* TO ‘mysqld_exporter’@’localhost’;
> FLUSH PRIVILEGES;
> exit
————————————–
[client]
user=mysqld_exporter
password=password
————————————-
[Unit]
Description=MySQL Exporter Service
Wants=network.target
After=network.target
[Service]
User=mysqld_exporter
Group=mysqld_exporter
Type=simple
Environment=”DATA_SOURCE_NAME=mysqld_exporter:password@tcp(127.0.0.1:3306)/”
ExecStart=/usr/local/bin/mysqld_exporter \
–config.my-cnf /etc/mysql_exporter/.my.cnf
–collect.global_status \
–collect.info_schema.innodb_metrics \
–collect.auto_increment.columns \
–collect.info_schema_processlist \
–collect.binlog_size \
–collect.global_variables \
–collect.info_schema.tablestats \
–collect.global_variables \
–collect.info_schema.query_response_time \
–collect.info_schema.userstats \
–collect.info_schema.tables \
–collect.perf_schema.tablelocks \
–collect.perf_schema.file_events \
–collect.perf_schema.eventswaits \
–collect.perf_schema.indexiowaits \
–collect.perf_schema.tableiowaits \
–collect.slave_status \
Restart=always
[Install]
WantedBy=multi-user.target
cant seem to save the prometheus.service file in systemd? is there some permissions missing?
Hello guys,
Help, Error Windows Server: parse “http://%E2%80%9810.10.24.11:9182%E2%80%99/metrics”: invalid port “:9182%E2%80%99” after host.
Open port 9182 Windows Server, check telnet connect.
Perfect content for PROMETHEUS Installation and Configuration.
Detailed information and easy to understand.
Hello Guys,
We have the application logs in an aws ec2 machine where the application would generate the logs in a folder
/home/ec2-user/ApplicationLogs/archive/.gz files ( Archived Application logs – 1)
and the current logs would be /home/ec2-user/ApplicationLogs/application_app.log where our team would be monitoring the logs every hour if in case we have any errors for every 1 hour so that we take the actions accordingly on the things.
We have come up with an idea where the prometheus setup can be made so that it shows in the graphs about the errors that we see in the logs .
How good is that solution so that we can have a UI to track the things very easily as look at the logs would be a harder things
Thanks for your help, my PROMETHEUS and GRAFANA dashboards are up and running!
How about to add postgresql Database
Thanks for the article, but you should know better than disabling SELINUX ! That’s reckless !