
Linux system administrators need a robust set of tools to monitor and optimize their systems effectively. A deep understanding of performance commands can help you quickly identify and resolve issues, ensuring smooth operations. In this article, we’ll delve into the top 10 Linux performance commands for system administrators, providing an overview of each command’s functionality and use cases.
Top 10 Linux performance commands for system administrators
Being a system administrator, over the years, I’ve curated a list of my top 10 Linux performance commands that I use daily. In this blog post, I’ll share my favorites with you and explain why I think they’re indispensable. So, without further ado, let’s dive in!
1. top
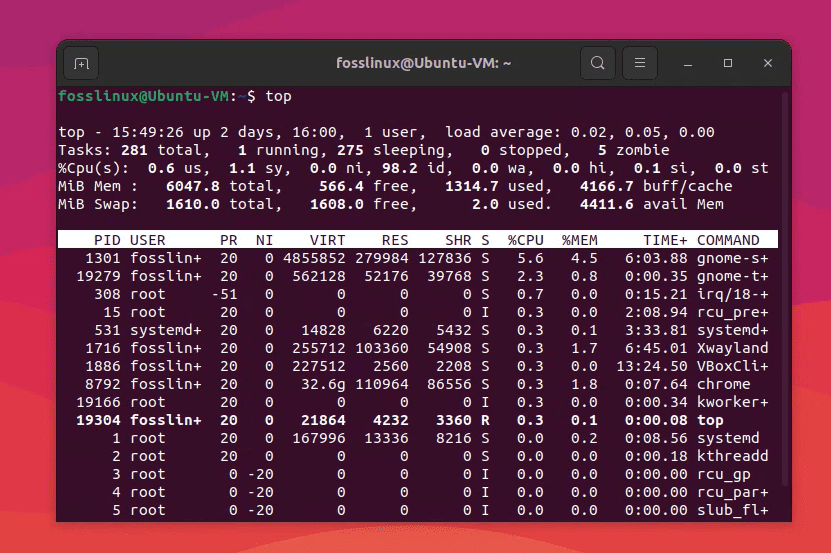
Top command usage
The ‘top’ command is my absolute favorite, and I’m sure many of you would agree. It provides a live, dynamic view of system processes, memory usage, and CPU load. To be honest, I love its simplicity and the ease with which I can identify resource-hungry processes.
Although some people prefer ‘htop’ for its color-coded display and additional features, I’m a diehard fan of the classic ‘top’ command.
To start using the ‘top’ command, simply type ‘top’ in the terminal and press Enter. You’ll see a real-time view of running processes, their resource usage, and various system statistics. This helps you quickly identify processes consuming high CPU or memory resources.
top
2. iostat
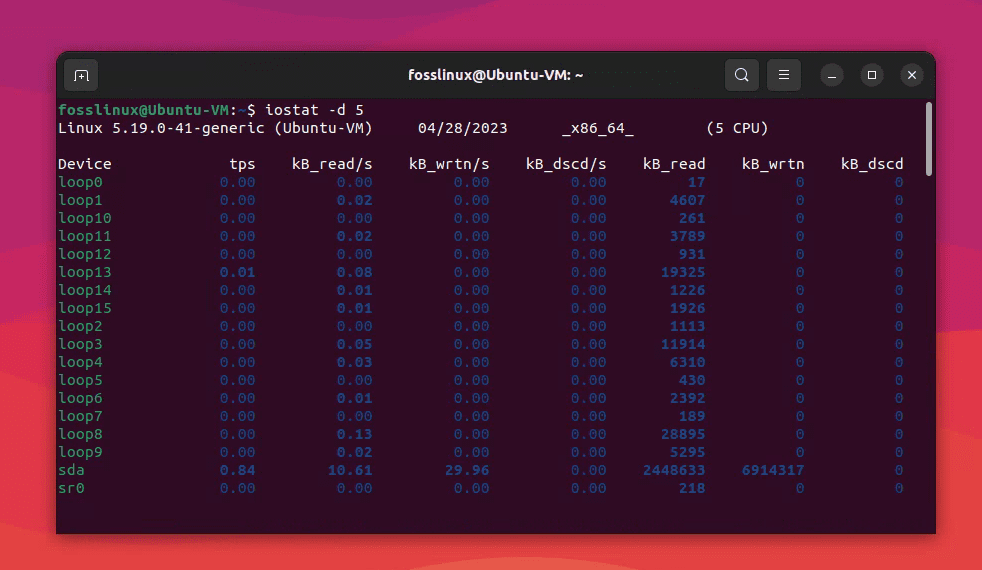
Iostat command usage
I’ve always found disk performance to be a critical aspect of system performance. That’s where ‘iostat’ comes in. It’s perfect for monitoring disk I/O and helps me spot potential bottlenecks.
The ‘iostat’ command is a part of the ‘sysstat’ package, which is not always pre-installed on Linux distributions. Here’s how to install ‘sysstat’ on some popular Linux distributions:
Debian and Ubuntu:
To install ‘sysstat’ on Debian and Ubuntu, open a terminal and run the following command:
sudo apt-get install sysstat
Red Hat, CentOS, and Fedora:
To install ‘sysstat’ on Red Hat-based systems, open a terminal and run the following command:
sudo yum install sysstat
Arch Linux:
To install ‘sysstat’ on Arch Linux, open a terminal and run the following command:
sudo pacman -S sysstat
SUSE and openSUSE:
To install ‘sysstat’ on SUSE and openSUSE, open a terminal and run the following command:
sudo zypper install sysstat
Once you’ve installed ‘sysstat,’ you can use the ‘iostat’ command to monitor disk I/O statistics. Remember to use ‘sudo’ or switch to the root user if you need elevated privileges to run the command. However, I do wish the default output was a bit more user-friendly. But hey, it gets the job done, and that’s what matters.
To display disk I/O statistics for all devices every 5 seconds, use the following command. This helps you monitor disk performance and identify bottlenecks.
iostat -d 5
3. vmstat
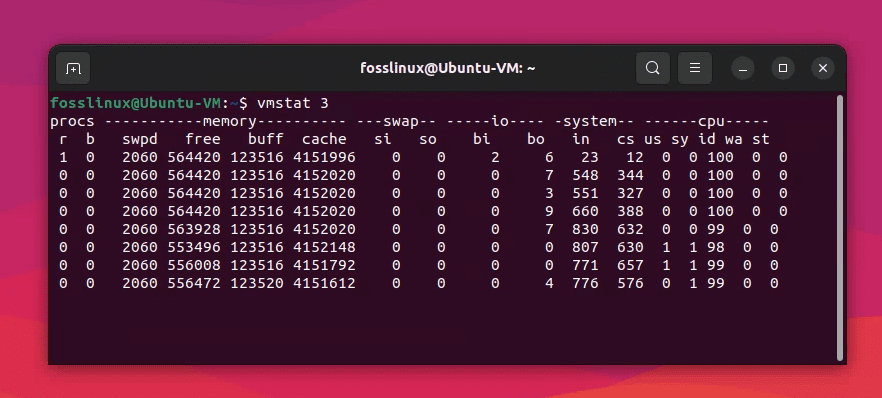
Vmstat command usage
‘vmstat’ is another command I rely on heavily. It reports virtual memory statistics, which helps me understand how the system is using memory and swap space. I find it particularly useful when dealing with memory-intensive applications.
The only thing I’m not a fan of is the somewhat cryptic output it produces. But once you get the hang of it, it’s a powerful tool. To display virtual memory statistics every 3 seconds, use the following command. This helps you understand how the system uses memory and swap space, which is useful when dealing with memory-intensive applications.
vmstat 3
4. free
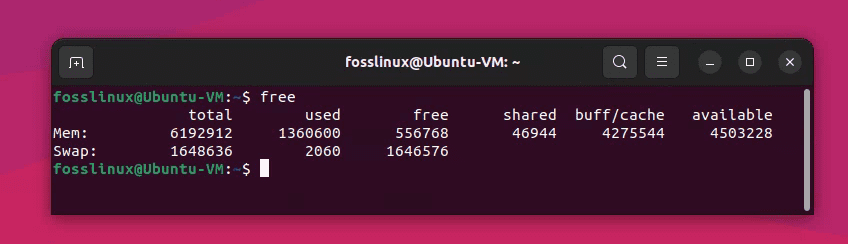
Free command usage
The ‘free’ command is excellent for getting a quick overview of the system’s memory usage. It’s simple, easy to read, and gets straight to the point. I like to use it to check if my servers have sufficient free memory.
My only gripe with ‘free’ is the lack of customization options, but it’s a minor issue considering its purpose. To display memory usage in a human-readable format, use the following command. This gives you a quick overview of total, used, and available memory and swap space.
free -h
5. sar
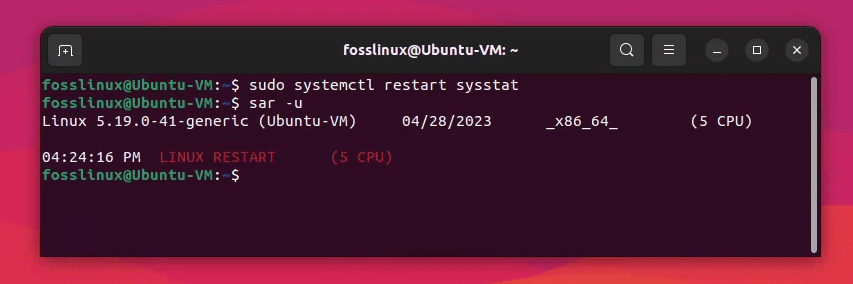
Sar command usage
‘sar’ is the Swiss Army knife of performance monitoring. It can provide information on almost every aspect of system performance, from CPU usage to network activity. I appreciate its versatility and the fact that it collects historical data, allowing me to analyze trends and diagnose past issues.
On the downside, the sheer number of options can be overwhelming. It’s a powerful tool but requires patience to master. To display the average CPU usage for the current day, use the following command. This helps you analyze CPU usage trends and diagnose past issues by collecting historical data.
Sar is also a part of systat package. Please refer “iostat” section to install systat on your Linux system before running the next command.
sar -u
Are you getting this error after running sar -u command?
Cannot open /var/log/sysstat/sa28: No such file or directory
Please check if data collecting is enabled
This error message indicates that the system activity data required for ‘sar’ is not being collected or stored. To fix this issue, we need to enable data collecting and configure the sysstat package correctly.
6. mpstat
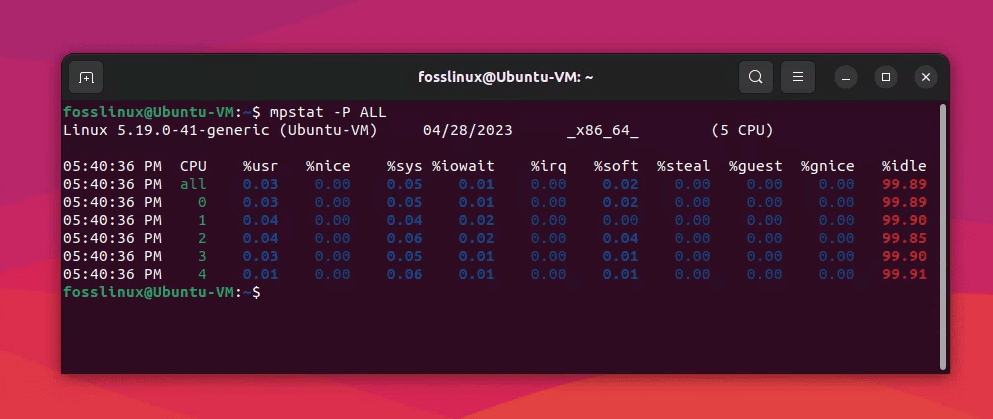
mpstat command usage
As a system administrator managing multi-core servers, ‘mpstat’ is a lifesaver. It shows the utilization of each processor core, which helps me understand the system’s load distribution. I find it especially useful for tuning applications that need to be optimized for multi-core systems.
I can’t really find any faults with this one – it does precisely what I need it to do! To display the CPU utilization for each processor core, use the following command. This helps you understand the system’s load distribution, which is particularly useful for tuning applications optimized for multi-core systems.
mpstat -P ALL
7. netstat
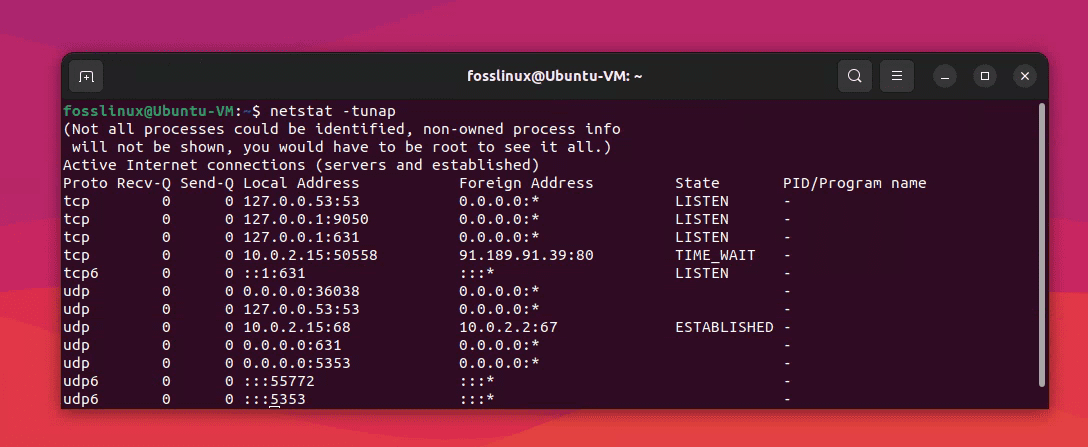
netstat command usage
Networking issues can be a real headache, and that’s where ‘netstat’ comes in handy. It’s my go-to command for monitoring network connections, routing tables, and interface statistics. I must admit, I have a soft spot for this one – it’s saved me from countless hours of troubleshooting.
The only downside is that it’s being deprecated in favor of ‘ss,’ but old habits die hard, and I still prefer using ‘netstat.’
To display all active network connections and their respective states, use the following command. This helps you monitor network connections and identify potential issues.
The ‘netstat’ command is a part of the ‘net-tools’ package, which is not always pre-installed on Linux distributions. Here’s how to install ‘net-tools’ on some popular Linux distributions:
Debian and Ubuntu:
To install ‘net-tools’ on Debian and Ubuntu, open a terminal and run the following command:
sudo apt-get install net-tools
Red Hat, CentOS, and Fedora:
To install ‘net-tools’ on Red Hat-based systems, open a terminal and run the following command:
sudo yum install net-tools
Arch Linux:
To install ‘net-tools’ on Arch Linux, open a terminal and run the following command:
sudo pacman -S net-tools
SUSE and openSUSE:
To install ‘net-tools’ on SUSE and openSUSE, open a terminal and run the following command:
sudo zypper install net-tools
Once you’ve installed ‘net-tools’, you can use the ‘netstat’ command to display active network connections and their states. Remember to use ‘sudo’ or switch to the root user if you need elevated privileges to run the command.
netstat -tunap
8. ss
Speaking of ‘ss,’ it’s a worthy successor to ‘netstat.’ It’s faster and more powerful, providing detailed information about sockets and network connections. I’m slowly warming up to it and must admit that it has grown on me over time.
It’s just a matter of getting used to the new syntax, and once you do, ‘ss’ can be a valuable addition to your toolkit.
To display detailed information about sockets and network connections, use the following command. It’s similar to netstat but faster and more powerful.
ss -tunap
9. lsof
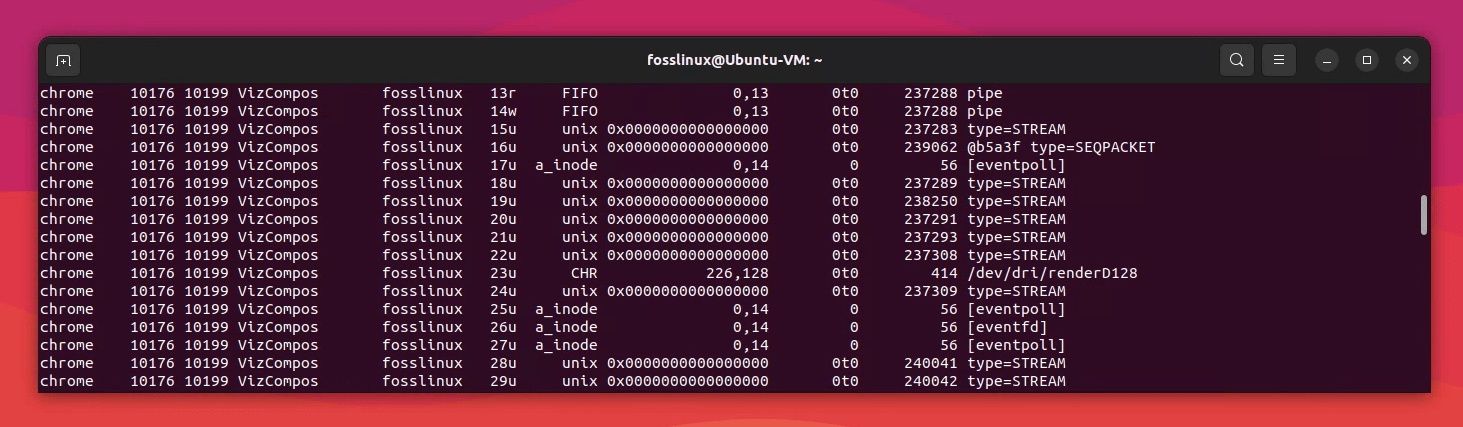
lsof command usage
‘lsof’ is an underrated gem. It stands for “list open files,” but it does much more than that. It can help you track down which processes are using specific files, directories, or sockets, which is extremely useful when debugging tricky issues.
The only downside is that the output can be quite verbose, and it may take some time to find the information you need. But overall, it’s a powerful command I wouldn’t want to be without.
To display a list of open files and the processes using them, use the following command. This is useful when debugging issues related to file usage, such as identifying processes that have locked specific files.
lsof
10. strace
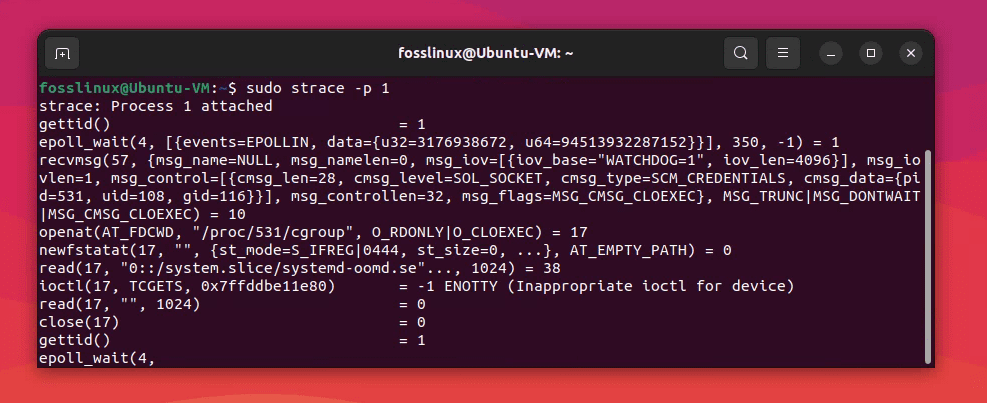
Strace command usage
Last but not least, ‘strace’ is a lifesaver when it comes to debugging application issues. It traces system calls and signals, allowing you to see exactly what a process is doing. I’ve lost count of the number of times this command has saved me when all other debugging methods failed.
However, ‘strace’ is not without its flaws. It can be slow, and the output can be difficult to decipher. But when you need it, there’s no substitute for the insights it provides.
To trace system calls and signals of a specific process, use the following command. This helps you understand what the process is doing, which can be invaluable when debugging application issues.
strace -p [PID]
Replace [PID] with the process ID of the process you want to trace.
There are several ways to see the PID of a process. I suggest using ps command for quick output.
ps -aux
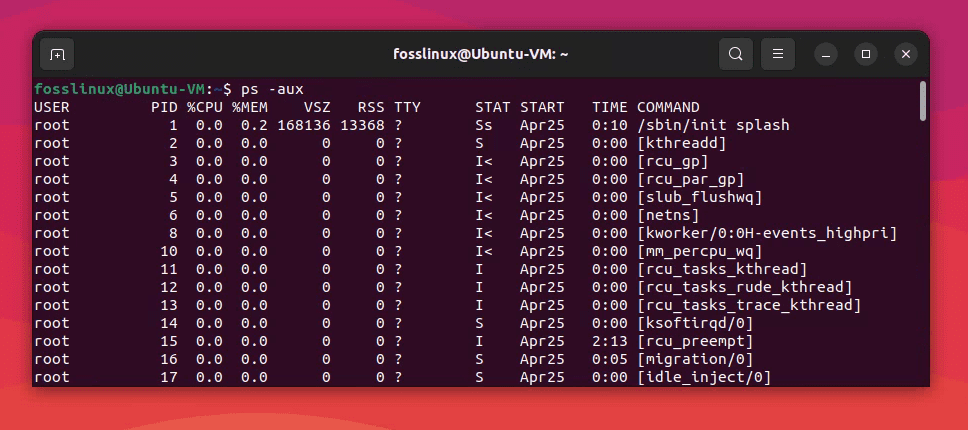
Using ps command to see PID
Practical example: Monitoring and troubleshooting high CPU usage on a Linux Server.
Suppose you’re a system administrator who received an alert about high CPU usage on a Linux server. You need to identify the processes consuming the most CPU resources and troubleshoot the issue. Here’s how you can use some of the commands mentioned above to accomplish this task:
1. Use ‘top’ to identify resource-hungry processes:
Run the ‘top’ command and look for processes that are consuming a high percentage of CPU resources. Press ‘M’ to sort the processes by memory usage, which can help identify processes with a potential memory leak that could be causing high CPU usage.
2. Use ‘mpstat’ to analyze CPU utilization by processor core:
Run ‘mpstat’ to get a breakdown of CPU utilization by processor core. This helps you identify if the high CPU usage is being caused by a specific core or a particular process.
3. Use ‘strace’ to trace the system calls made by a process:
If you suspect a specific process is causing high CPU usage, use ‘strace’ to trace its system calls and signals. This can help you identify any system calls that are taking a long time to complete, which could be the cause of the high CPU usage.
4. Use ‘sar’ to collect historical data:
If the high CPU usage is intermittent, use ‘sar’ to collect historical data and analyze trends. This helps you identify if the high CPU usage is occurring at specific times or if it’s a constant issue.
By using these commands in combination, you can quickly identify the processes causing high CPU usage and troubleshoot the issue. You can also use other commands like ‘iostat’ or ‘vmstat’ to monitor other system resources and identify potential bottlenecks.
Helpful tips for using Linux performance commands
1. Practice, practice, practice:
The more you use these commands, the more comfortable you will become with them. Try running them in different scenarios, and experiment with their various options to get a better understanding of how they work.
2. Customize the output:
Many of these commands provide output in a default format, but you can customize the output to meet your needs. For example, you can use the ‘-h’ option with ‘free’ to display memory usage in a human-readable format, or use ‘-p’ with ‘netstat’ to display the PID of the process using a particular port.
3. Use multiple commands together:
Many system administration tasks require you to monitor multiple system resources simultaneously. You can use multiple commands together, such as ‘top’ and ‘vmstat,’ to get a better overall picture of the system’s performance.
4. Use command-line options:
Some of these commands have a wide range of options that you can use to customize their behavior. For example, you can use the ‘-A’ option with ‘mpstat’ to display CPU utilization for all processor cores or use the ‘-n’ option with ‘sar’ to monitor network statistics.
5. Document everything:
When troubleshooting issues or monitoring system performance, it’s important to document your findings. This helps you track changes over time and identify recurring issues. You can use tools like ‘grep’ or ‘awk’ to extract specific data from the output of these commands and store it in a file for future reference.
By following these tips, you can become more proficient in using these commands and better equipped to manage and optimize your Linux systems.
Conclusion
There you have it – my top 10 Linux performance commands for system administrators, complete with my personal opinions, likes, and dislikes. Of course, every sysadmin has their preferences, and this list may not cover everything you need. But these are the commands I’ve come to rely on, and I believe they form a solid foundation for anyone looking to monitor and optimize their Linux systems.