
Wireshark is a free and well-known network communication link analyzer formerly known as Ethereal. It presents captured packet data in as much detail as possible. You can contemplate a network packet analyzer as a measuring gadget for cross-examining what is happening inside a network cable, just like an electrician utilizes a voltmeter to check what is inside an electric cable.
Sometime back, Wireshark and look-alike tools were either expensive, proprietary, or both. Nevertheless, the dawn of Wireshark has enormously changed to the point that it is now available for free, open-source, and it has proven to be one of the best packet analyzers available in the market today.
Wireshark features
- Wireshark is available for Unix and Windows.
- It captures live packet data from a network interface.
- Filters packets on many criteria
- Creates various statistics.
- Opens files containing packet data captured with tcpdump/WinDump.
- Wireshark and other packet capture programs.
- Saves captured data packets.
- Uses a network interface to capture live packet data.
- Imports packets from text files containing hex dumps of packet data.
- Exports some or all packets in several capture file formats.
Having looked at that vital piece of info, let us now turn our focus and look at the core part of the article that explains how to install Wireshark on Debian 11, and also look at how to get started with this packet analyzer that has proven to be useful for several functionalities including sniffing, network problems troubleshooting and a lot more.
In case you don’t have Debian installed on your machine, we suggest you can take a look at our other article on How to install Debian 11 before proceeding with the article.
How to install Wireshark on Debian 11
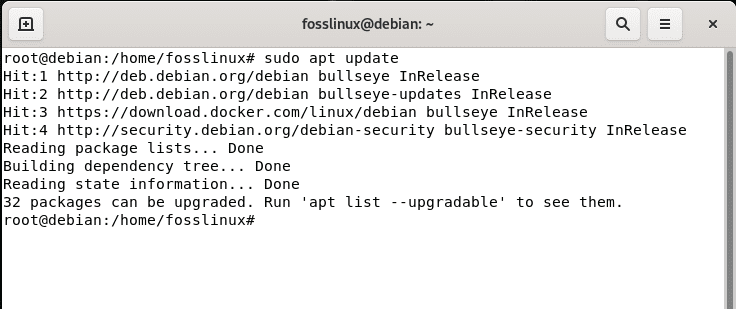
We will run the following commands on our Debian 11 machine to install Wireshark. Still, as usual, we will kick off by updating our Debian 11 packets version information using the following command:
sudo apt update
update system
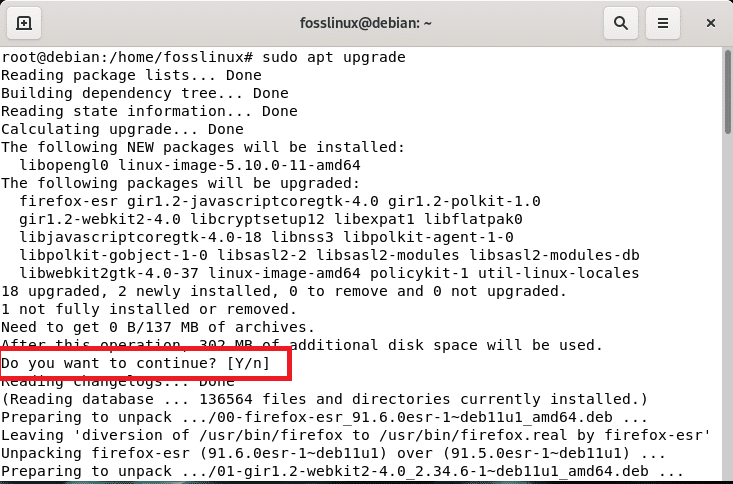
After that, the terminal will notify you of the number of packages that require an upgrade. If there are, like in our case, 32 packages, then run the following command to upgrade the “32 packages”:
sudo apt upgrade
upgrade system
Note: Upon running the command, you will be asked to affirm your decision to proceed with the installation. Here you will type “y/Y” or press “Enter,” and the process will continue.
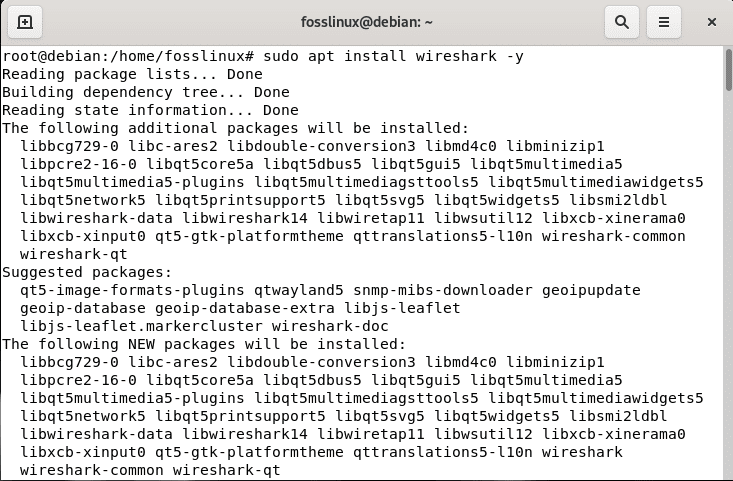
In case all your packages are up to date, then skip the upgrading process and directly go to the installation of Wireshark that we will carry out using apt, a command-line utility software used for installing, removing, updating, upgrading, and otherwise managing deb packages on Debian, Ubuntu, and look-alike Linux distros as shown below:
sudo apt install wireshark -y
install Wireshark
While installing the software, you will be prompted whether to allow non-superusers to capture packets or not; here, you will select “yes” using the keyboard arrow keys and press “Enter” for the process to complete.

select Yes
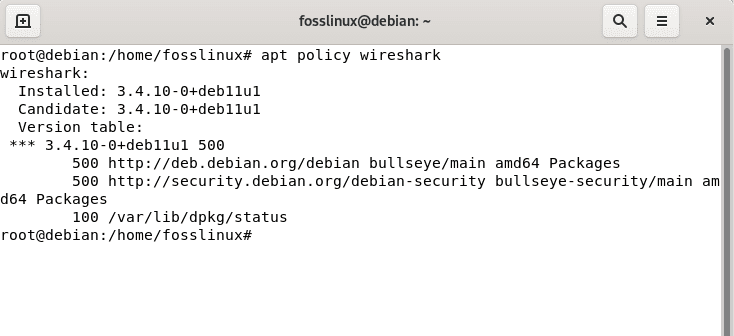
In the wake of installing Wireshark, you can run the following command to confirm the version installed:
apt policy wireshark
confirm the installed version
Launching Wireshark
To attain this, go to the “activities” menu on the left-hand side of the Debian 11 desktop and search for Wireshark from your applications menu or Applications Finder. You should find the software installed as shown in the screenshot below:
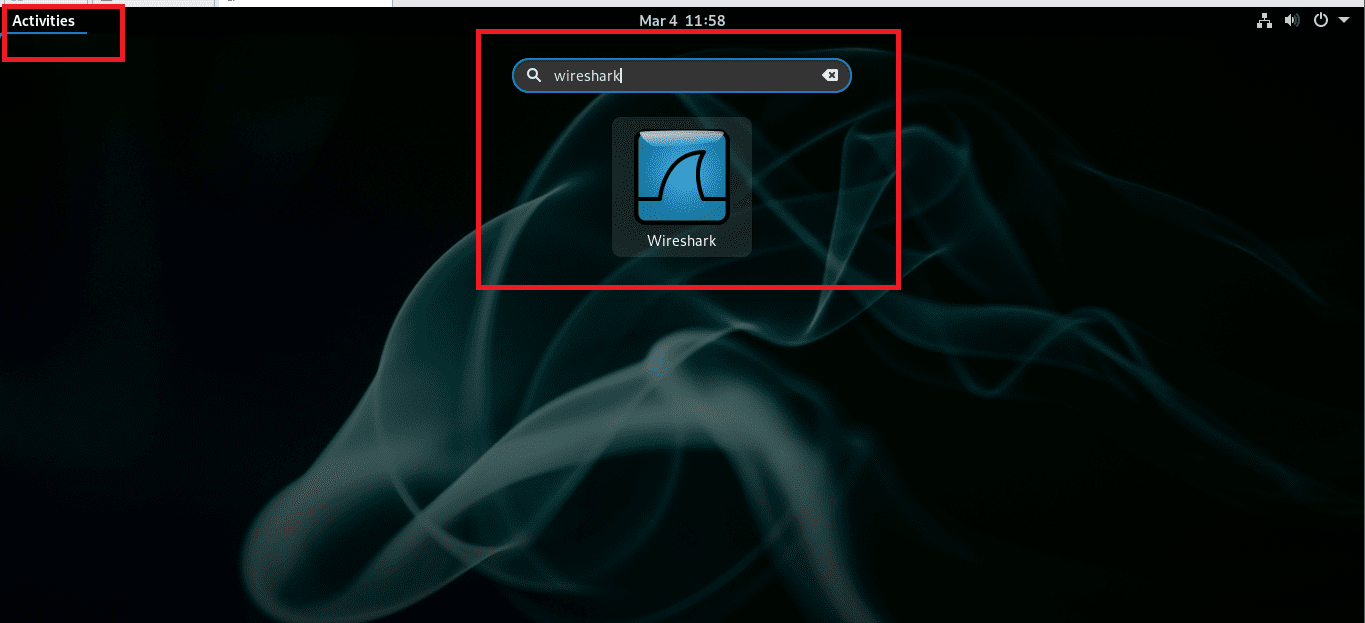
Type Wireshark
To launch Wireshark, select the software by double-clicking on it:
Welcome screen
There, a welcome screen will show up. Then, you will go ahead and select your network device to capture packets and press the shark fin icon as displayed in the snapshot below to fire up the capturing of network traffic.
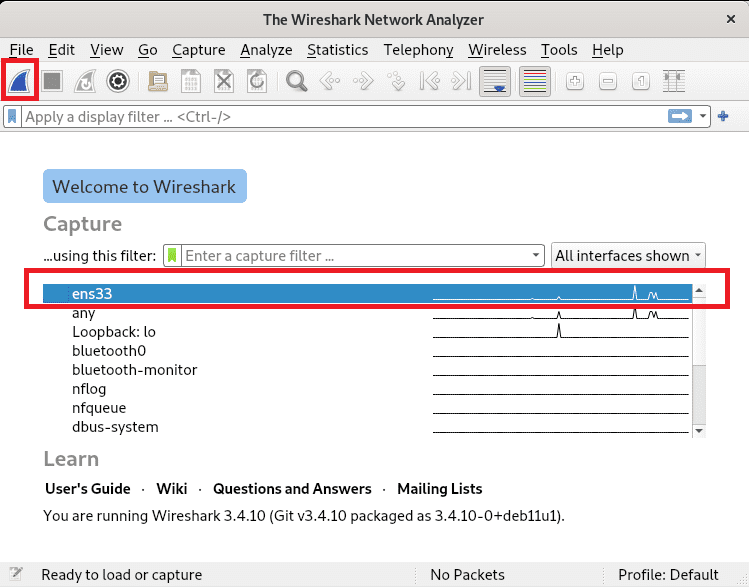
select your network device
After looking at the installation process of this remarkable software, let us now take a look at getting started with the software.
Getting started with Wireshark
You can launch the software from the Graphical interface using the Application menu or Application Finder, as earlier explained in the article.
In cases where you already know the network interface you will use to monitor the network, you can fire up the software by running the following command, where <Device> is replaced by the network device you are using. The snapshot below shows a Wireshark execution utilizing the network interface named ens33.
sudo wireshark -i <Device> -k
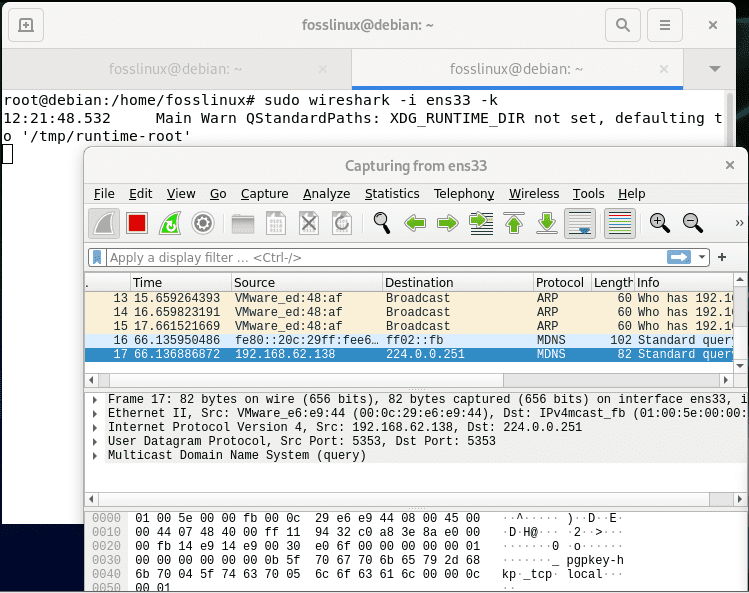
getting started
Note: You can visit this link to find additional launching options.
The Wireshark Graphical User Interface (GUI)
For a better insight of Wireshark, let us split the screen into six sections: Menu, toolbar, filter toolbar, packet list pane, packet details pane, and packet bytes pane. The snapshot below displayed the location of each of the six named sections.
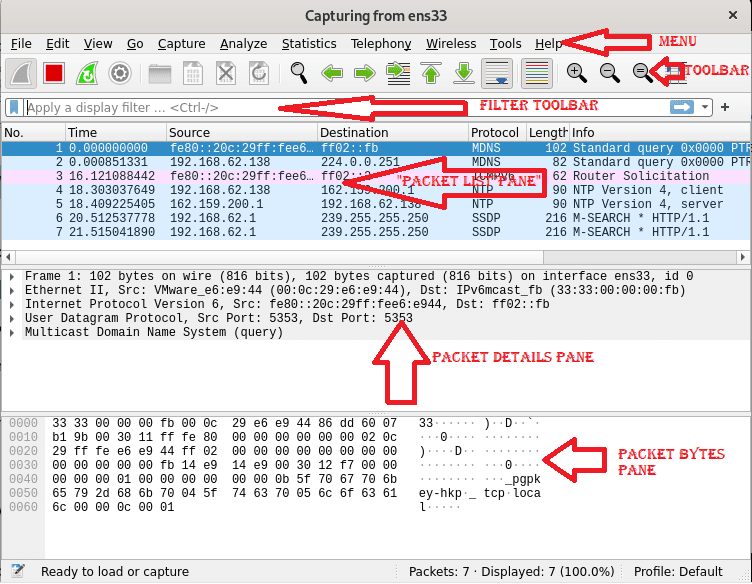
Wireshark GUI
Where each section contains the following:
Menu: The menu section comprises items to manage capture files, save export and print out part or all captures. On the Edit tab next to File, options to find packets, manage configuration profiles, and some preferences occur. Finally, the view tab on the flip side allows managing display options like specific packet colorization, additional windows, fonts, and more.
The Go tab permits you to run an inspection of specific packets. The capture tab allows to begin and halt capturing files and editing filters. You can disable or enable protocol dissection manipulate displays filters from the Analyze tab, among additional options.
The telephony tab allows you to display telephony statistics. The wireless tab shows Bluetooth and IEE 802.11 statistics. The tools tab has available tools for Wireshark, while the Help menu contains manual and help pages.
Toolbar: The main toolbar has buttons to start, restart, and stop capturing packets. You can save, close, and reload capture files from the toolbar. This menu also allows you to access additional capture options or find particular packets. You can also pass to the next packet or revert to the previous one. The toolbar includes display options to colorize packets zoom in and out, among others.
Filter Toolbar: This toolbar is vital in specifying the type of packet you want to capture allows the flexibility of specifying the type of packets you want to drop. For instance, to capture all packets whose source port is 36, you can type “tcp src port 36.” Likewise, to do away with all arp packets, you can type “not arp.”
Packet List: The packet list category shows packets in the capture file. The available columns display the quantity or say the number of packets in the File, destination addresses, the packet’s timestamp, the source, the packet length, and the protocol. The information column shows appended information. If you select a packet in this section, more details on the particular packet will be shown in the “Packet Details” and “Packet Bytes” panes.
Packet Details: The Packet Details pane displays additional info on protocol, TCP analysis, response time, IP geolocation, and checksum. This pane also shows possible links or a relationship between different packets.
Packet Bytes: This pane here displays a hex dump of packets, which includes data offset, sixteen hexadecimal bytes, sixteen ASCII bytes.
After looking at that vital piece of info, let us concentrate on capturing packets with Wireshark.
Capturing Packets Using Wireshark
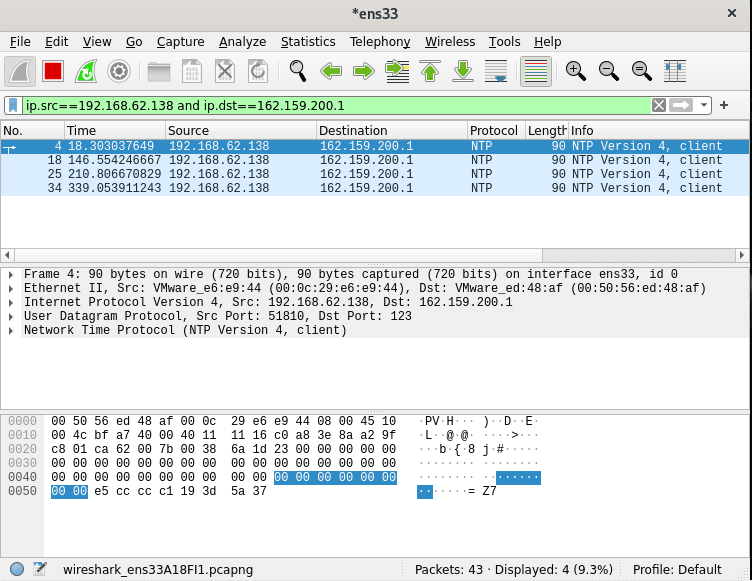
The following instance displays how to capture packets belonging to communication between two particular devices simply. As seen in the snapshot below, the filter toolbar contains the filter “ip.src==192.168.62.138 and ip.dst==162.159.200.1” which tells Wireshark to capture files whose source is the IP address 192.168.62.138 and whose destination is the IP 162.159.200.1.
 Immediately you are done capturing packets, press the stop capturing icon shown in the snapshot below to halt the capturing process.

stop button
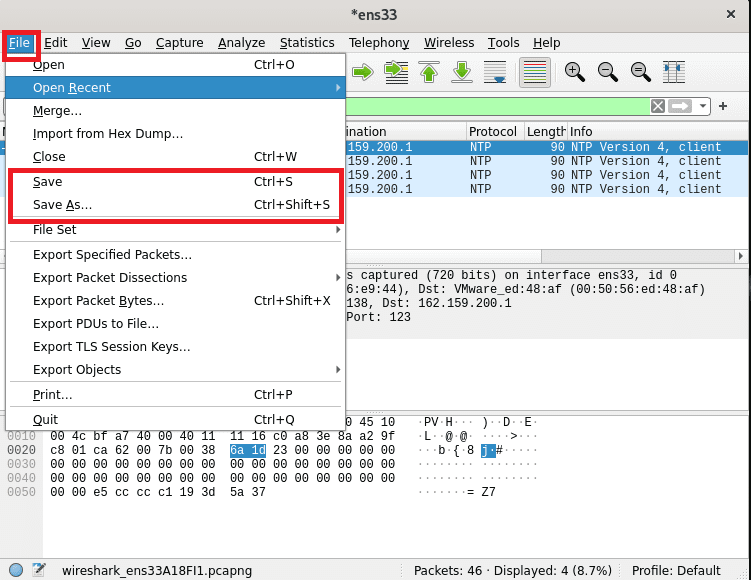
Then after stopping the capture process of packets, you can go ahead and save your captured File by pressing on File>Save or File>Save as then save using your preferred name as shown in the snapshot below:
save packet data
And boom! You are good to go. That is probably all there is to start studying how to use Wireshark.
Final Thoughts
As seen in the guide above, installing Wireshark software on Debian 11 is as simple as running some apt command with just a single command. It is true to say that any Linux-level user can install it, be it a newbie, intermediary, or guru. At the same time, system admins must know this or similar tools for carrying out simplified network analysis. Wireshark has proven to be a very flexible tool that allows users of all walks to capture and analyze packets quickly. In real scenarios, Wireshark is useful in detecting anomalies in network traffic. It can also be adapted to sniff traffic; hackers and system admins searching for bad traffic need to know how to implement this tool.
With that said, thank you for reading this guide. We hope it was informative enough.