
Pop!_OS, with its sleek design and robust performance, is a haven for power users and developers alike. However, understanding and monitoring its system resources is crucial for maintaining its efficiency.
In this article, we’ve explored a variety of tools tailored for different aspects of system monitoring – from general resource usage to specific hardware components like GPUs and network interfaces. These tools, ranging from the straightforward to the more complex, are essential for anyone looking to get the most out of their Pop!_OS experience.
Why monitor system resources?
Before diving into the tools, let’s understand why it’s important. Monitoring system resources helps in identifying bottlenecks, ensuring optimal performance, and sometimes, it’s just satisfying to see those graphs and numbers – a geek’s delight!
Monitoring system resources on Pop!_OS
1. Built-in tools
Pop!_OS, being an Ubuntu derivative, comes with GNOME System Monitor. It’s a straightforward tool that gives you a quick glance at CPU, memory, and network usage. However, I find it a bit basic for my taste, especially when I want more in-depth information.
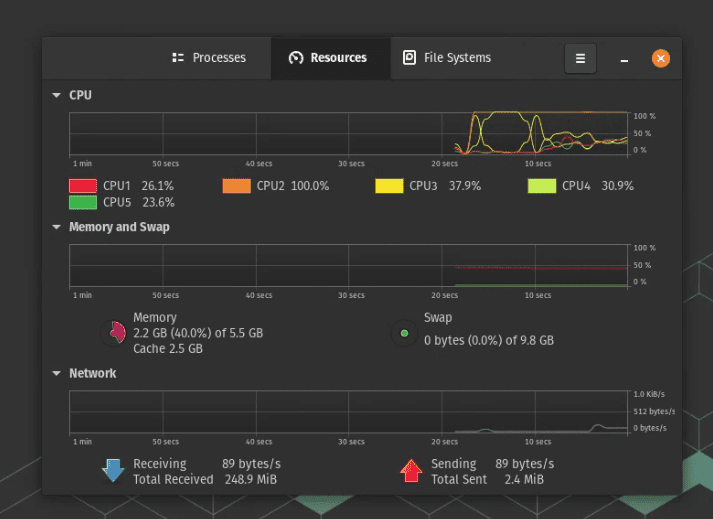
Pop!_OS Built-in GNOME System Monitor App
2. Advanced monitoring with htop
This is where ‘htop’ comes into play. It’s a powerful terminal-based tool that I personally prefer due to its detailed and color-coded display. To install it, use:
sudo apt install htop
Once installed, just type htop in your terminal, and voilà! You’ll see a detailed overview of CPU, memory, and process usage. What I love about htop is its real-time updates and the ability to kill processes quickly – invaluable when something goes rogue.
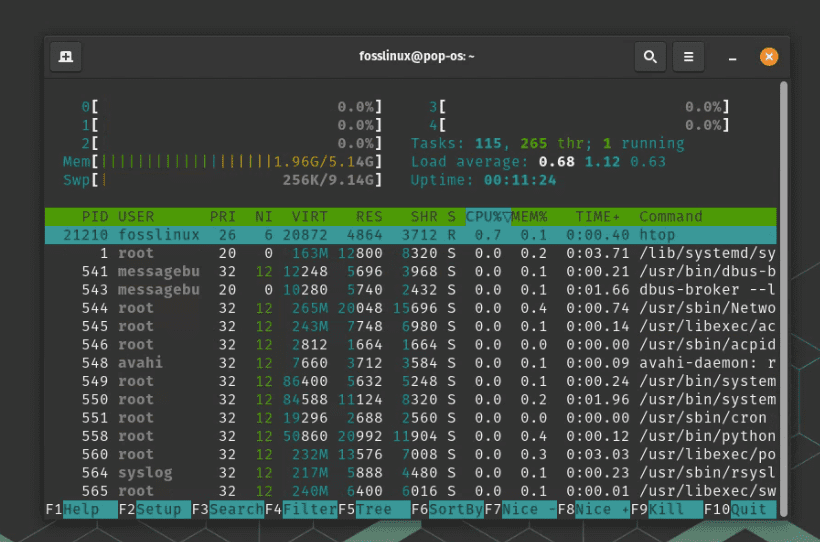
HTOP on Pop!_OS
3. Delving deeper with Glances
When htop doesn’t cut it, I turn to ‘Glances’. It’s like htop on steroids. Installing Glances is a breeze:
sudo apt install glances
Glances show system resources, but it also includes disk I/O, network I/O, and even sensor readings. It’s my go-to when I suspect my system is heating up more than usual.
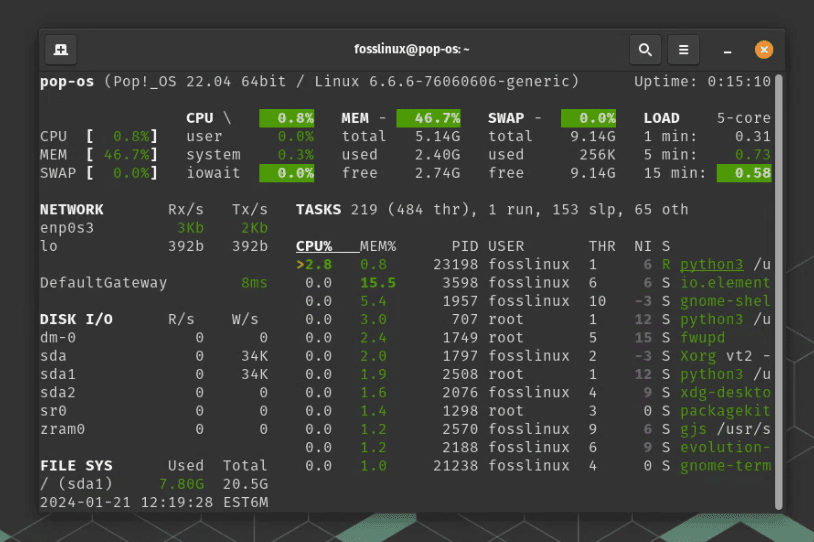
Glances on Pop!_OS
4. System monitoring with Conky
For those who love customization, ‘Conky’ is a gem. It’s a lightweight system monitor that displays information on your desktop background. The level of customization can be overwhelming, but once you get the hang of it, it’s highly rewarding.
To install Conky:
sudo apt install conky
Then, it’s all about editing the .conkyrc file to display what you want. I spend hours tweaking it to match my desktop theme!
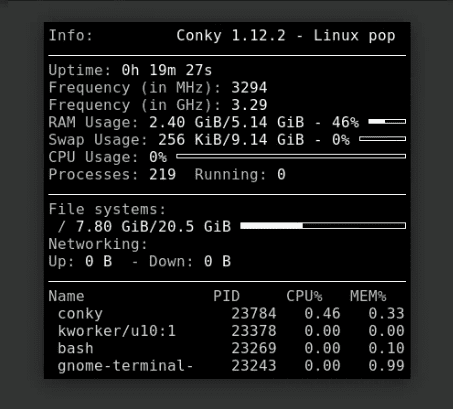
Conky on Pop!_OS
5. Hardware monitoring
GPU monitoring
NVIDIA users can use nvidia-smi for real-time GPU monitoring. It’s great for keeping an eye on GPU loads, especially for gamers and data scientists.
nvidia-smi
For Intel and AMD GPU users, tools like intel_gpu_top and radeontop are handy.
Let’s go through the quick steps to install nvidia-smi, intel_gpu_top, and radeontop on Pop!_OS. These tools are essential for monitoring NVIDIA, Intel, and AMD GPUs respectively.
Installing nvidia-smi
For NVIDIA GPU users, nvidia-smi is usually pre-installed if you have the NVIDIA drivers. However, if it’s not present, you can install it by installing the NVIDIA drivers:
- Update your system:
sudo apt update
sudo apt upgrade
- Install NVIDIA Drivers (if not already installed): Pop!_OS provides an easy way to install proprietary NVIDIA drivers.
- Go to Settings > Details > About
- Click on “Graphics” to choose and install the appropriate NVIDIA driver.
- Verify Installation: Once installed, you can check
nvidia-smiby running:nvidia-smi
Installing intel_gpu_top
For Intel GPU monitoring, intel_gpu_top is part of the intel-gpu-tools package.
- Install intel-gpu-tools:
sudo apt install intel-gpu-tools
- Run intel_gpu_top: To monitor your Intel GPU, simply run:
sudo intel_gpu_top
Note: Running
intel_gpu_topmight require root privileges.
Installing radeontop
For those with AMD GPUs, radeontop is a great tool.
- Install radeontop:
sudo apt install radeontop
- Run radeontop: After installation, you can run it with:
sudo radeontop
Like
intel_gpu_top,radeontopmight also require root access to function correctly.
CPU and temperature
For detailed CPU monitoring, I recommend i7z for Intel processors. It gives you a comprehensive view of CPU frequencies and temperatures.
sudo apt install i7z
To monitor overall system temperatures, lm-sensors is a great package.
sudo apt install lm-sensors
sensors
Network monitoring
Basic network monitoring
The default system monitor gives basic network information, but for more, we need specialized tools.
Advanced network monitoring with iftop
iftop is a tool I frequently use for real-time network usage monitoring.
sudo apt install iftop
Wi-Fi analysis with wavemon
For Wi-Fi networks, wavemon is a fantastic tool. It helps in analyzing Wi-Fi signal strength and quality.
sudo apt install wavemon
Bandwidth usage with vnStat
For tracking bandwidth usage, vnStat is an invaluable tool. It’s lightweight and runs in the background, logging data over time.
sudo apt install vnstat
Using system logs
Sometimes, the graphical tools don’t tell you everything. This is where system logs come in. The journalctl command is a gateway to a wealth of information about your system. It’s not the most user-friendly, but it’s incredibly powerful for troubleshooting.
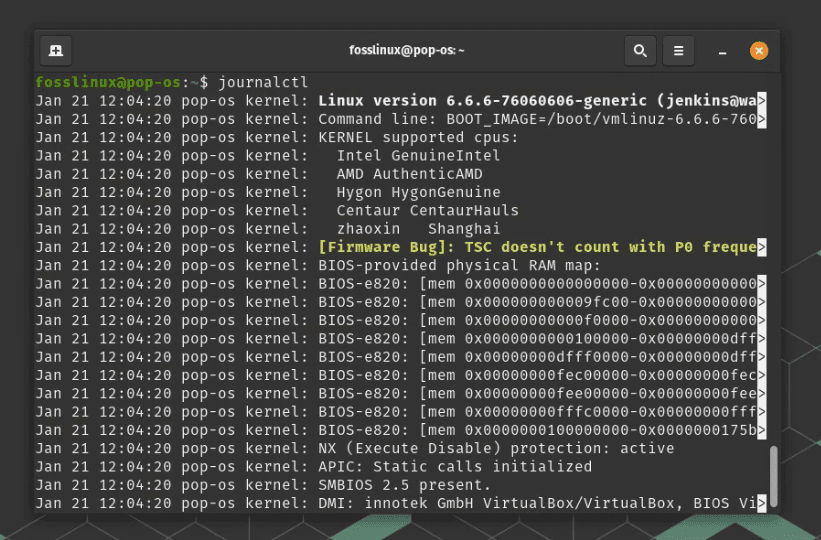
Journalctl in Pop!_OS
Conclusion
Monitoring system resources on Pop!_OS can range from basic to highly advanced, depending on your needs and curiosity level. Tools like htop, Glances, and Conky provide a wealth of information and can be fun to explore and customize. And let’s not forget the humble system logs that can often be the unsung heroes in troubleshooting. Happy monitoring, and may your system always run smoothly and efficiently!