
Grafana is free software that allows users to query, visualize, alert, and understand their metrics regardless of where they are stored. Besides, Grafana will enable you to easily create, analyze, and share dashboards with your team, fostering a data-driven culture. Grafana is a multi-platform, open-source active monitoring and data visualization tool that displays detailed analytics on charts and graphs.
It has reusable dynamic dashboards, ad-hoc queries for exploring metrics, alert rules for key metrics to review and send notifications in the event of changes, and built-in sharing for collaboration with team members, among other features. It also can integrate with data sources such as InfluxDB, Graphite, Elasticsearch, and Prometheus.
Installing Grafana on Debian
In this article, I’ll show you how to install Grafana on Debian 11 bullseye. Grafana is available for download from the official Grafana package repositories, and it can be installed on most Linux distros such as Ubuntu, Debian, and Red Hat.
Prerequisites
- A non-root user with sudo access
- Fully updated Debian 11 OS
Install Grafana on Debian
There are numerous ways to install the most recent ver ion of Grafana on Debian 11. These consist of:
- Install from the Grafana Official APT repository
- Download and install the a.deb package
- Install by downloading the a.tar.gz binary file.
All three methods will be c vered in this article guide. Therefore, to learn more, continue reading this article tutorial guide.
Method 1: Install from the Grafana Official APT repository
This method to install Grafana is beneficial as it automatically allows users to update it while running the apt-get update command.
Below is a list of the most common Grafana versions and their repositories:
- Grafana Enterprise – https://packages.grafana.com/enterprise/deb stable main
- Grafana OSS – https://packages.grafana.com/oss/deb stable main
- Grafana Enterprise (Beta) – https://packages.grafana.com/enterprise/deb beta main
- Grafana OSS (Beta) – https://packages.grafana.com/oss/deb beta main
Follow the brief guide below to install both versions of Grafana on your Debian OS.
Install the latest Enterprise Edition:
sudo apt-get install -y apt-transport-https

sudo apt-get install -y software-properties-common wget

wget -q -O - https://packages.grafana.com/gpg.key | sudo apt-key add –
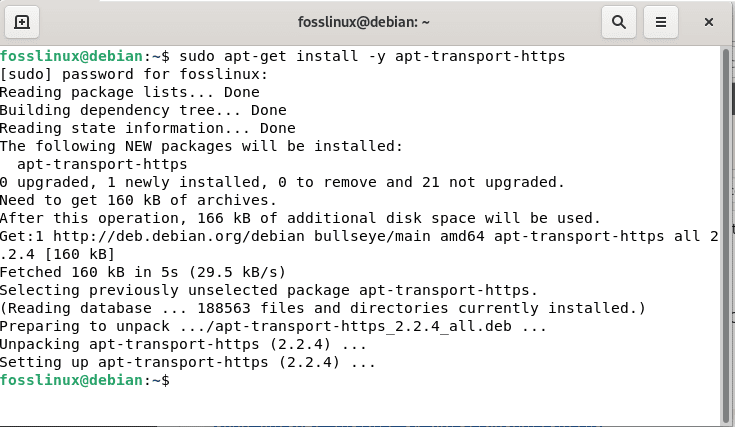
Install grafana
For a stable release, add the following repo to your Debian 11 OS:
echo "deb https://packages.grafana.com/enterprise/deb stable main" | sudo tee -a /etc/apt/sources.list.d/grafana.list
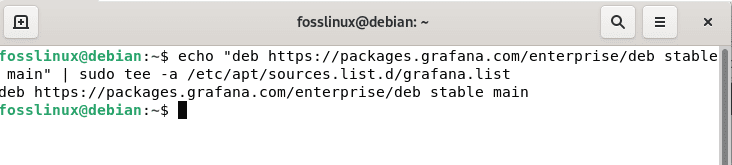
Grafana repo
For a beta release, add the following repo to your Debian 11 OS:
echo "deb https://packages.grafana.com/enterprise/deb beta main" | sudo tee -a /etc/apt/sources.list.d/grafana.list
Once the repository has been added, run the following commands on your terminal to update repositories and install the latest version of Grafana.
sudo apt-get update

sudo apt-get install grafana-enterprise
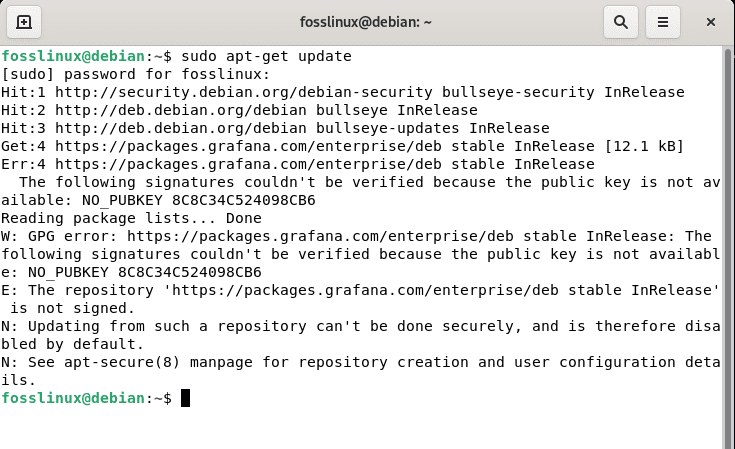
Update resources
Install the latest OSS Edition:
sudo apt-get install -y apt-transport-https

sudo apt-get install -y software-properties-common wget

wget -q -O - https://packages.grafana.com/gpg.key | sudo apt-key add –
For a stable release, add the following repo to your Debian 11 OS:
echo "deb https://packages.grafana.com/oss/deb stable main" | sudo tee -a /etc/apt/sources.list.d/grafana.list
For a beta release, add the following repo to your Debian 11 OS:
echo "deb https://packages.grafana.com/oss/deb beta main" | sudo tee -a /etc/apt/sources.list.d/grafana.list
Once the repository has been added, run the following commands on your terminal to update repositories and install the latest version of Grafana.
sudo apt-get update

sudo apt-get install grafana
Method 2: Installing Grafana using the a.deb package
Installing Grafana using the .deb package might be disadvantageous since you must manually update it to get the most recent version. Follow the steps provided herein to complete the installation process:
Step 1: Choose the Grafana rendition you want to install from the Grafana official download page.
- By default, the most recent Grafana version is selected.
- Only completed releases are shown in the Version field. To install a beta version, go to Nightly Builds and choose your preferred version.
Step 2: Choose an Edition.
- Enterprise Edit on– Download is recommended. Functionally identical to the open-source version but has additional features that can be unlocked with a license if desired.
- Open Source (OSS) Edition– Functionally identical to the Enterprise version; however, if you want Enterprise features, you must download the Enterprise version.
Step 3: Select Linux or ARM depending on your operating system.
Step 4: Launch your terminal and execute the following lines of code to download and install Grafana using the .deb package.
Note: When I wrote this article guide, the latest version of Grafana was 9.0.0. Therefore, to install this .deb package, use the lines of code below:
sudo apt-get install -y adduser libfontconfig1

wget https://dl.grafana.com/oss/release/grafana_9.0.0_amd64.deb

sudo dpkg -i grafana_9.0.0_amd64.deb
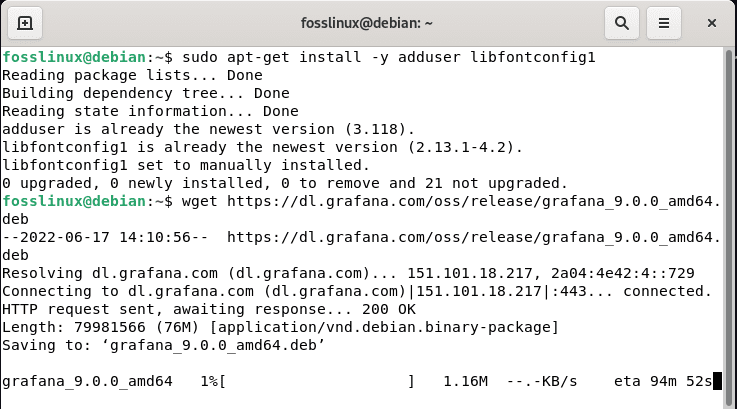
Download .deb file
That’s all you have successfully installed Grafana using the .deb package.
Method 3: Installing Grafana using .tar.gz binary file
This method is quite similar t method two mentioned above. However, in this section, we shall use a .tar.gz binary fi e instead of a .deb package. Therefore, follow the steps provided below to complete the installation using a .tar.gz binary file:
Step 1: Choose the Grafana rendition you want to install from the Grafana official download page.
- By default, the most recent Grafana version is selected.
- Only completed releases are shown in the Version field. To install a beta version, go to Nightly Builds and choose your preferred version.
Step 2: Choose an Edition.
- Enterprise Edit on– Download is recommended. Functionally identical to the open-source version but has additional features that can be unlocked with a license if desired.
- Open Source (OSS) Edition– Functionally identical to the Enterprise version; however, if you want Enterprise features, you must download the Enterprise version.
Step 3: Select Linux or ARM depending on your operating system.
Step 4: Launch your terminal and execute the following lines of code to download and install Grafana using the.tar.gz binary file.
For instance, when I wrote this article guide, the latest version of Grafana was 9.0.0. therefore, to install this version using the.tar.gz method, launch your terminal and execute the lines of code below:
wget https://dl.grafana.com/enterprise/release/grafana-enterprise-9.0.0.linux-amd64.tar.gz

tar -zxvf grafana-enterprise-9.0.0.linux-amd64.tar.gz
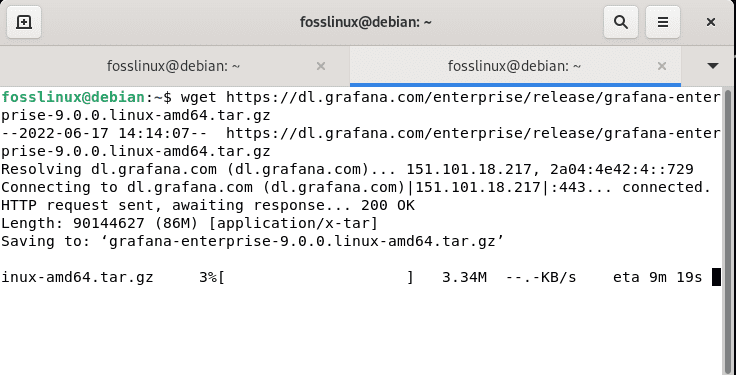
Download the .tar.gz file
Now that Grafana has been successfully installed on our Debian 11 Bullseye let us proceed and learn how to start the Grafana server.
Starting the Grafana Server
After you have finished installing Grafana, you will need to start grafana-server by following the step shown below:
sudo /bin/systemctl start grafana-server
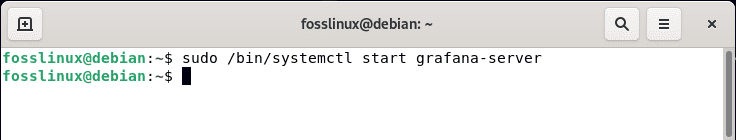
Start grafana server
For some Debian users, you will first need to reload the system daemon settings by executing this command line:
systemctl daemon-reload
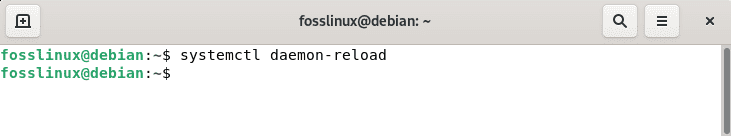
Reload daemon
Next, you can use the command below to start the Grafana service and tell it to run when the system starts up;
systemctl enable --now grafana-server
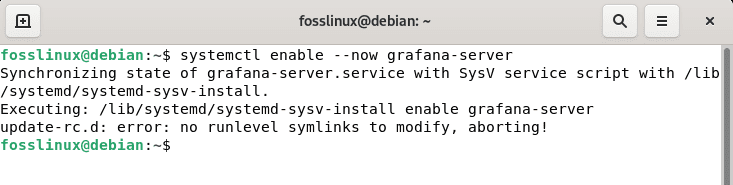
Enable Grafana server
Once that is complete, proceed and check the Grafana status by running this command:
systemctl status grafana-server.service

Check Grafana service status
Starting the Grafana server with init.d
To launch the service and confirm that it has started executing the following lines of code:
sudo service grafana-server start

sudo service grafana-server status
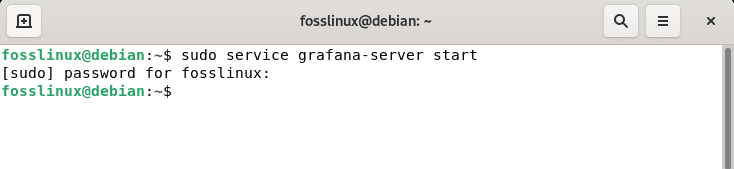
Start server
Setup the Grafana server to launch at boot:
sudo update-rc.d grafana-server defaults
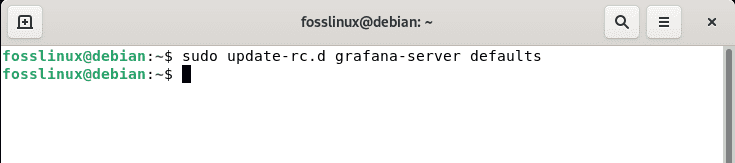
Start Grafana at boot
How to serve Grafana on a port?
To start Grafana on a port less than 1024, you must add a systemd unit override to your configuration. To create an override file in your configured editor, run the following command:
systemctl edit grafana-server.service
To grant the CAP_NET_BIND_SERVICE capability, add these additional settings.
[Service]

CapabilityBoundingSet=CAP_NET_BIND_SERVICE

AmbientCapabilities=CAP_NET_BIND_SERVICE

PrivateUsers=false
Executing the Binary
The working directory for the grafana-server binary.tar.gz must be the root install directory containing the binary and the public folder.
Launch Grafana by typing the URL below on your browser:
http://localhost:3000
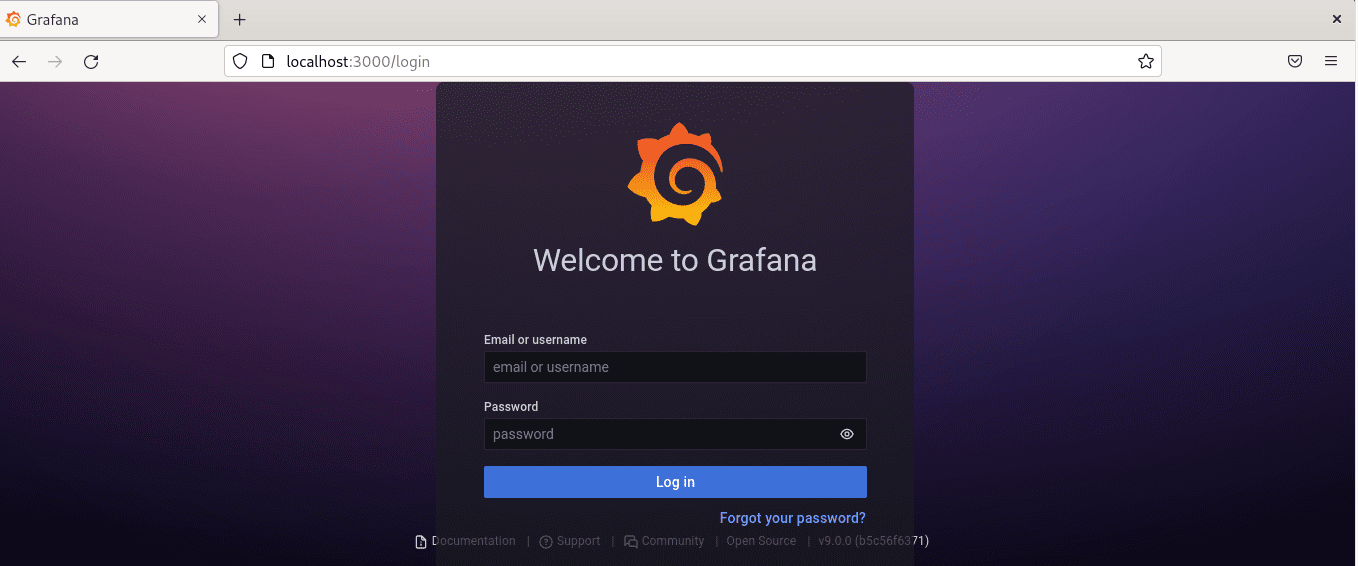
Login to grafana
Using Grafana
Once the Grafana server is up and running, you can use the URL to get to it.
“admin” is the default user n me and the password for Grafana. You will have to change it after you log in to Grafana.
After logging in, you must change your password, type in a secure password, and click the Login button.

Create new password
The first screen of Grafana is shown below.
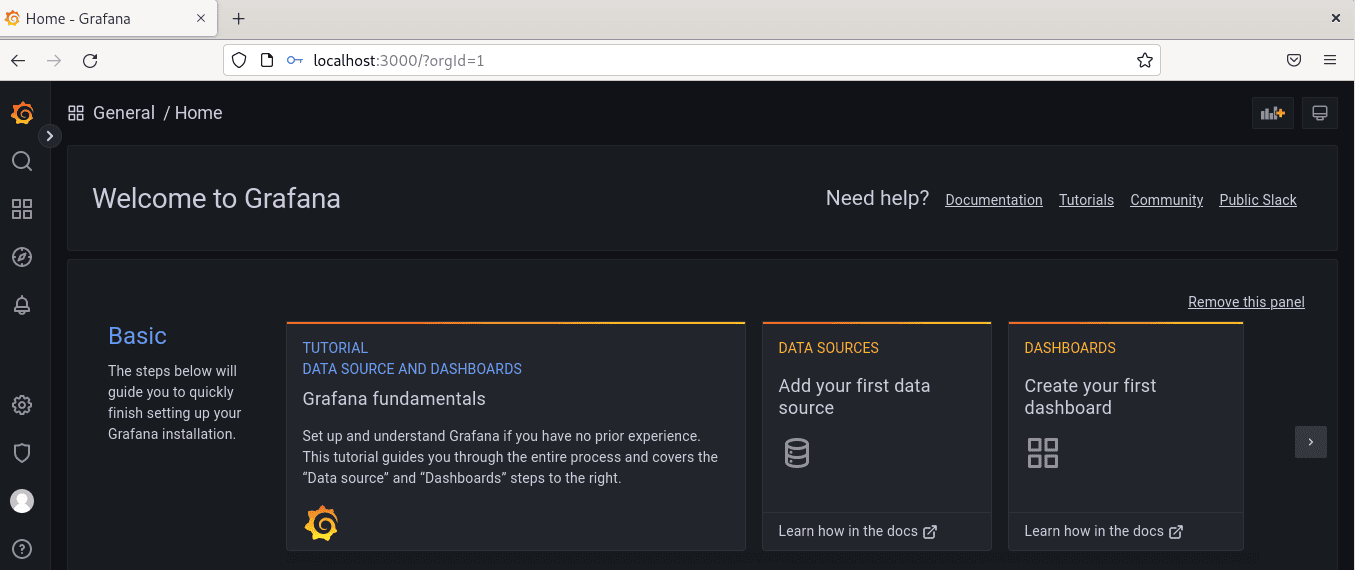
Grafana welcome screen
You need to make at least a dashboard and a data source. Data Sources are a group of plugins that let you connect to Google Cloud services or database systems that are not part of your computer. Press the DATA SOURCES button, as shown below, to make data sources.
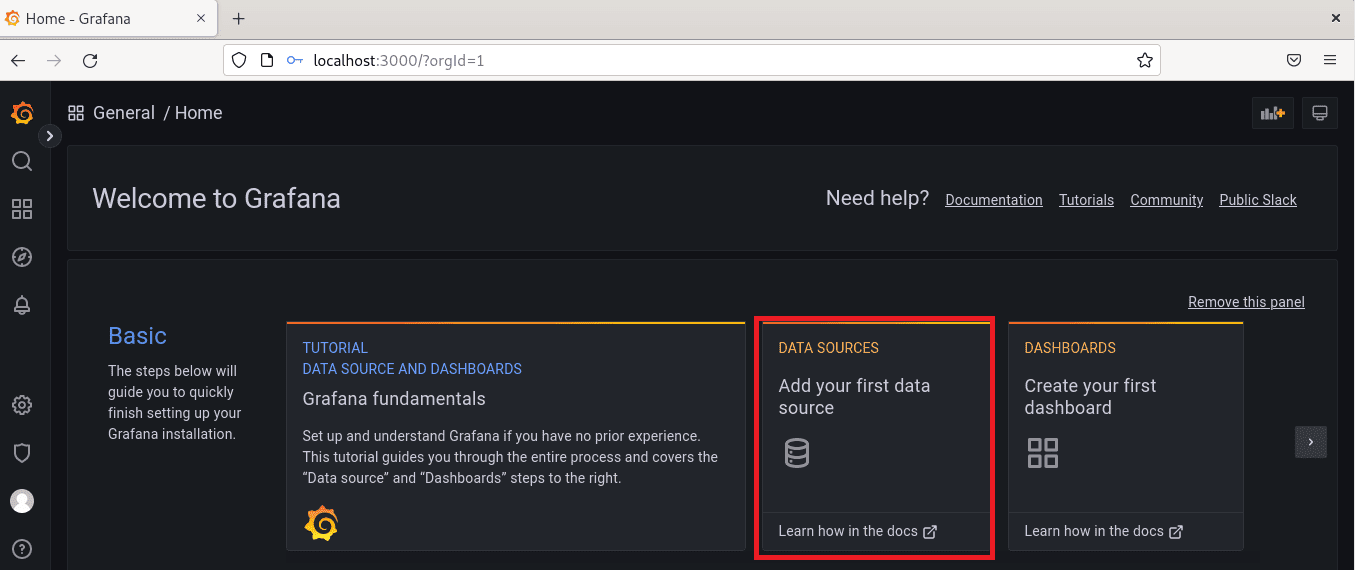
Grafana welcome screen
As shown in the illustration below, you can access abundant data sources. You can either scroll down or use the search bar to locate the desired item. Select the source you wish to use, fill out the required fields on the screen displayed below, and click Save & test:
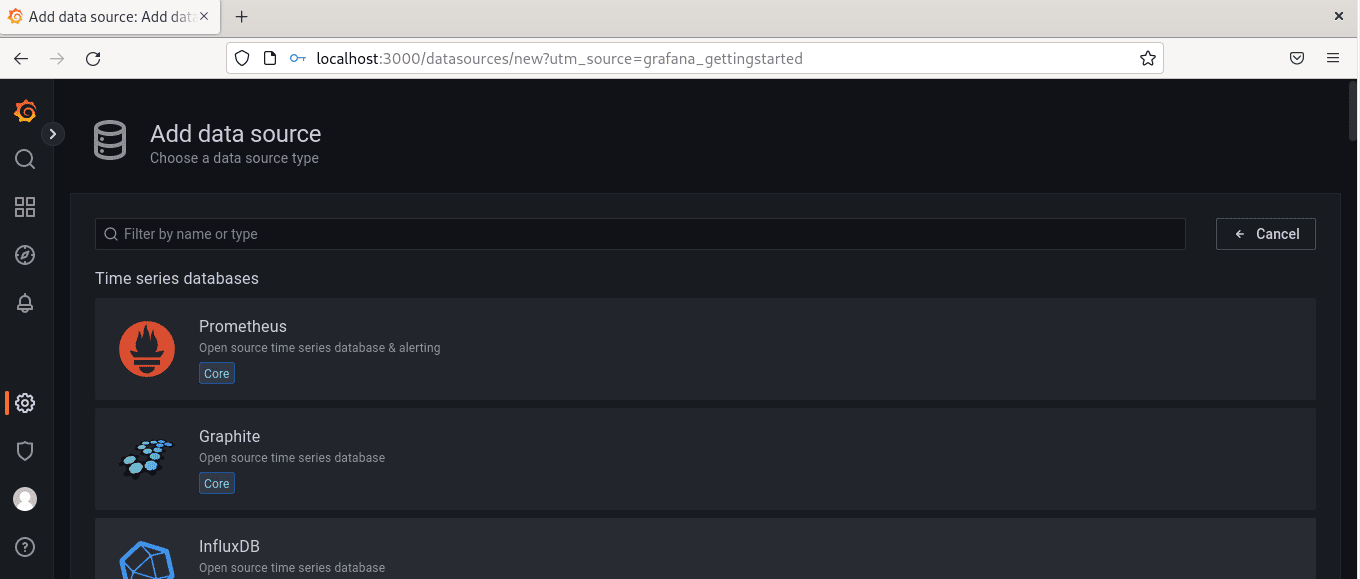
Add data sources
Grafana enables the creation and customization of dashboard panels. The display properties are fully modifiable, so you can display the da a based on your preferences. The displayed data is obtained from a multitude of accessible data sources. To create a dashboard, select DASHBOARDS from the main screen’s menu on the left.
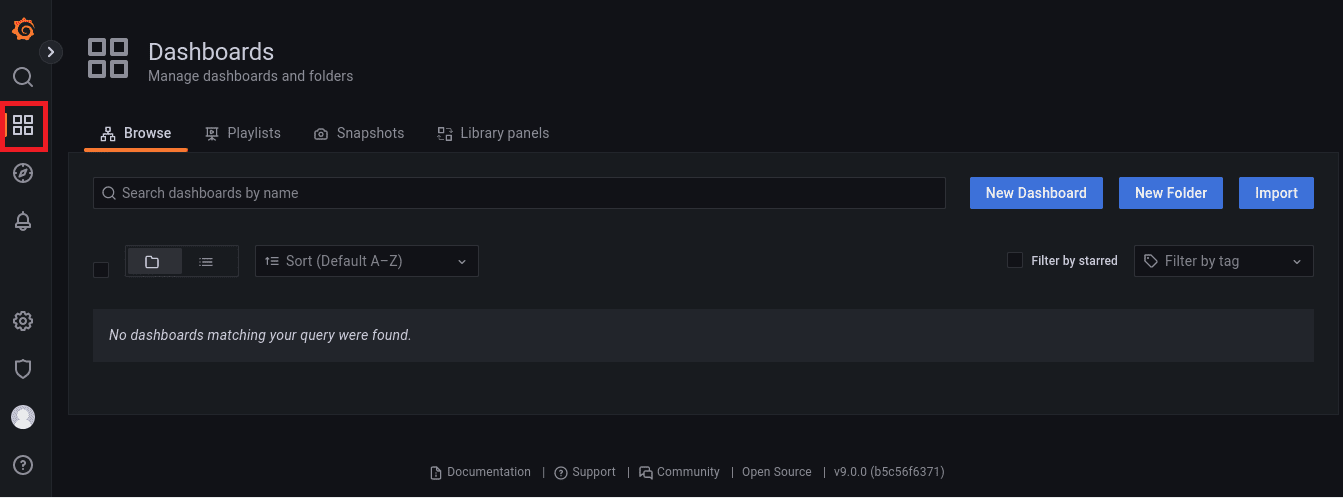
Dashboards
You can add new panels and rows and use panels from a library on the dashboard creation page. You are free to create as many dashboards as you would like. Before beginning with panels, configure the data sources. By adding panels, you can incorporate multiple data sources into a single dashboard.
Grafana package details
Grafana installs the binary to:
/usr/sbin/grafana-server
Grafana installs the init.d script to:
/etc/init.d/grafana-server
Crafana creates the default “environment vars” file to:
/etc/default/grafana-server
Grafana installs the configurations file to:
/etc/grafana/grafana.ini
Grafana installs the system service name to:
grafana-server.service
Grafana sets the default config file to:
/var/log/grafana/grafana.log
Grafana default config specifies an SQLite3 database to:
/var/lib/grafana/grafana.db
Grafana installs HTML/CSS/JS and other common files to:
/usr/share/grafana
That’s all you need to know in this article guide.
Conclusion
Grafana has a fantastic virtual interface since you can configure it and generate several visual alternatives. Grafana is also widely supported, continually extending the plugin library. Some supported data sources include MySQL, PostgreSQL, Microsoft SQL, and more databases; you can also configure it using APIs provided by many data sources.
1 comment
You seem to not have noticed yet that “apt-key add -” is heavily deprecated.
Please fix.